

Solver-markedsplads
Udforsk efter funktionalitet (rapporter, planlægning og dashboard-skabeloner), eller brug søgefunktionen til at filtrere efter integration, branche eller for at finde en skabelon, der passer til dine specifikke behov. Gem skabeloner på din favoritliste, og brug linket »Del favoritter« til at dele listen med andre.
Ikonforklaring:
💲 Kræver konsulenttimer til opsætning og konfiguration
⭐ Gem som favorit og del med andre
FUNCTIONALITY
- Reports
- Planning
- Dashboard
Data Source
Marketplace Data Source: Filter by Data Source to find assets specific to your system
Showcase Data Source: Filter by Data Source to find assets specific to your system
Industries
Marketplace Industries: Filter by Industries to find assets specific to your system
Showcase Industries: Filter by Industries to find assets specific to your system
industries
Marketplace Industries: Filter by your industry to find assets created for your specific needs
Showcase Industries: Filter by your industry to find assets created for your specific needs
427 - 432 of 868 Results
Favorite Page Results
Favorites


Dashboard
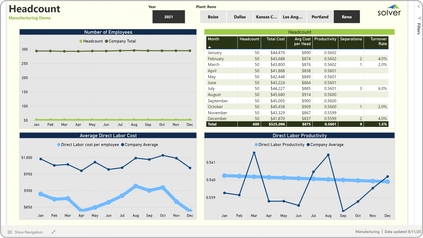
Mfg – Personnel Cost and Productivity
It gives the user four angles of analysis, including:. Plant headcount and total headcount - monthly trend,.
$
Planning
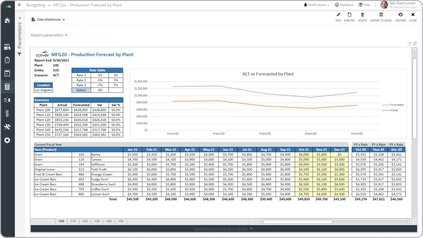
Mfg – Production Forecast per Plant
Key functionality template automatically displays actual amounts by item for the year-to-date periods. These figures are driven from price and quantity figures. Each tab in the template represents a different plant.
$
Reports
Dashboard
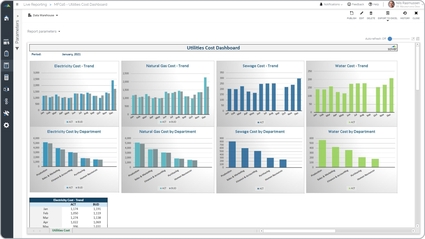
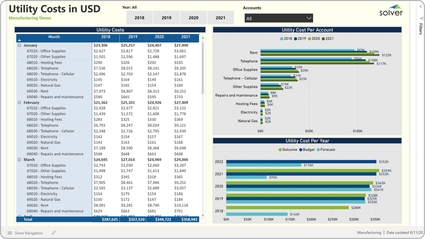
Mfg – Utility Cost Analysis
It compares expenses over months, years and GL accounts. Utility cost metrics by GL account by month over the last four years,.
$
Reports
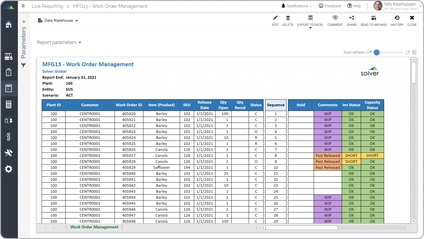
Mfg – Work Order Management
It shows work orders by plant, customer and item. It also displays production sequence, inventory and capacity statuses.
$
Dashboard
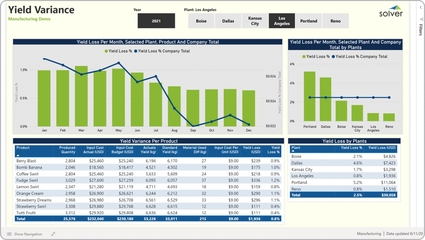
Mfg – Yield Analysis
It provides yield loss and variance analysis from four different perspectives. Monthly trend in yield loss for selected plant and for the company total,.
$