

Solver-markedsplads
Udforsk efter funktionalitet (rapporter, planlægning og dashboard-skabeloner), eller brug søgefunktionen til at filtrere efter integration, branche eller for at finde en skabelon, der passer til dine specifikke behov. Gem skabeloner på din favoritliste, og brug linket »Del favoritter« til at dele listen med andre.
Ikonforklaring:
💲 Kræver konsulenttimer til opsætning og konfiguration
⭐ Gem som favorit og del med andre
FUNCTIONALITY
- Reports
- Planning
- Dashboard
Data Source
Marketplace Data Source: Filter by Data Source to find assets specific to your system
Showcase Data Source: Filter by Data Source to find assets specific to your system
Industries
Marketplace Industries: Filter by Industries to find assets specific to your system
Showcase Industries: Filter by Industries to find assets specific to your system
industries
Marketplace Industries: Filter by your industry to find assets created for your specific needs
Showcase Industries: Filter by your industry to find assets created for your specific needs
403 - 408 of 868 Results
Favorite Page Results
Favorites


Reports
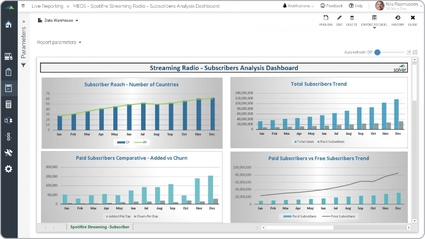
Media – Streaming Radio Analysis
It shows monthly trends for six different KPIs, including:. Current year (CY) and prior year (PY) subscriber reach by number of countries,.
$
Reports
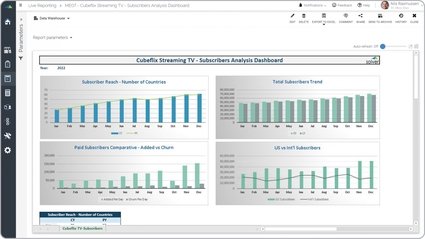
Media – Streaming TV Analysis
It provides monthly trend analysis from four different perspectives:. Current year (CY) and prior year (PY) subscribers by number of countries reached,. Paid subscribers added versus churned,.
$
Dashboard
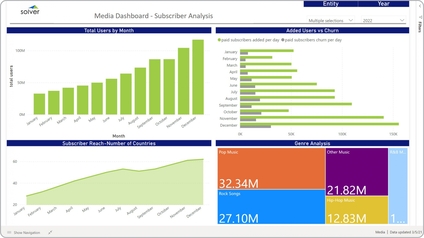
Media – Subscriber Analysis
It provides analysis of user KPIs from four different perspectives, including:. Monthly trend in total number of users,. Number of added users and churn per day,.
$
Reports
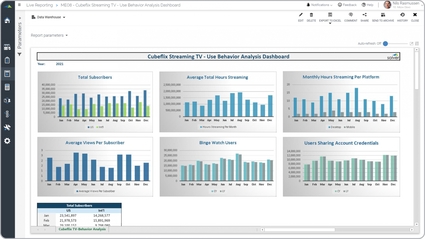
Media – Use Behavior Analysis
Analyzes audience or subscriber usage behavior patterns across content types, platforms, and time periods. Helps media finance and product teams understand consumption trends and optimize content monetization.
$
Dashboard
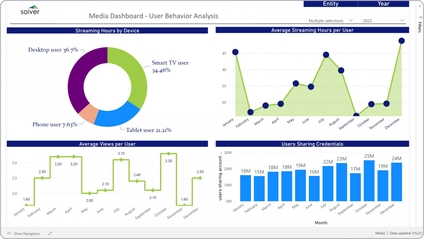
Media – User Behavior Analysis
It enables graphical analysis of user behavior from four different perspectives, including:.
$
Dashboard
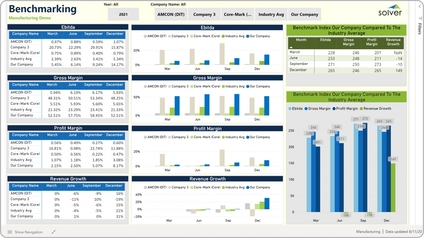
Mfg – Benchmarking
It enables the user to select which companies (including the industry average) and year to use in the analysis, and then it will provide graphical comparison.
$