

Solver-markedsplads
Udforsk efter funktionalitet (rapporter, planlægning og dashboard-skabeloner), eller brug søgefunktionen til at filtrere efter integration, branche eller for at finde en skabelon, der passer til dine specifikke behov. Gem skabeloner på din favoritliste, og brug linket »Del favoritter« til at dele listen med andre.
Ikonforklaring:
💲 Kræver konsulenttimer til opsætning og konfiguration
⭐ Gem som favorit og del med andre
FUNCTIONALITY
- Reports
- Planning
- Dashboard
Data Source
Marketplace Data Source: Filter by Data Source to find assets specific to your system
Showcase Data Source: Filter by Data Source to find assets specific to your system
Industries
Marketplace Industries: Filter by Industries to find assets specific to your system
Showcase Industries: Filter by Industries to find assets specific to your system
industries
Marketplace Industries: Filter by your industry to find assets created for your specific needs
Showcase Industries: Filter by your industry to find assets created for your specific needs
157 - 162 of 868 Results
Favorite Page Results
Favorites


Reports
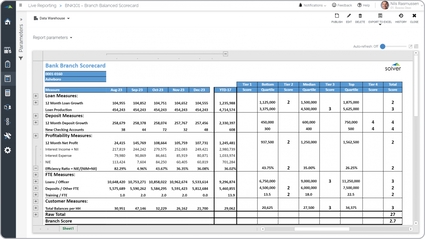
Bank – Branch Scorecard
Some of the main functionality strategic report is that it presents a total score per bank branch based on a series of strategic KPIs. These include: Loan measures, Deposit measures, Profitability measures, FTE measures, and Customer measures.
$
Reports
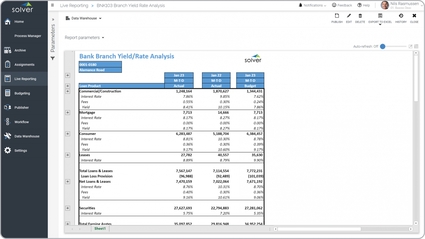
Bank – Branch Yield Rate Analysis
It is parameter-driven by branch and period and it compares current month metrics with prior year and budget.
$
Reports
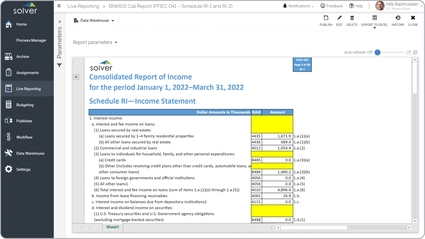
Bank – Call Report Example
The Consolidated Statement of Income is considered a Call Report and is used by accountants and compliance managers to submit quarterly data as per Office of the Comptroller of the Currency (OCC) requirements.
$
Reports
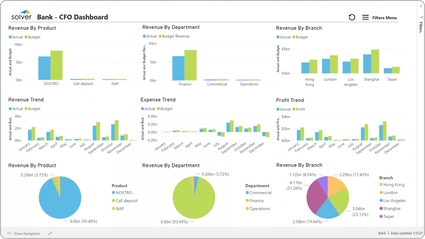
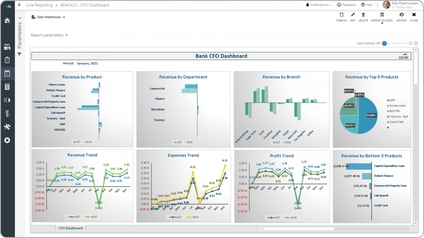
Bank – CFO Dashboard
It provides graphical analysis of eight different metrics, including:. Actual versus budgeted revenues by product,. Monthly revenue trend,.
$
Dashboard
Bank – CFO Power BI Dashboard
It provides financial analysis from nine different perspectives:. Actual and budget revenue by product,. Monthly actual and budget revenue trend,.
$
Reports
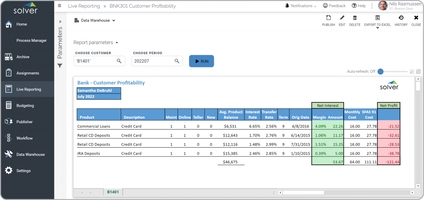
Bank – Customer Profitability
It enables the user to select the customer and the period to see the profitability by product and in total.
$