

Solver-markedsplads
Udforsk efter funktionalitet (rapporter, planlægning og dashboard-skabeloner), eller brug søgefunktionen til at filtrere efter integration, branche eller for at finde en skabelon, der passer til dine specifikke behov. Gem skabeloner på din favoritliste, og brug linket »Del favoritter« til at dele listen med andre.
Ikonforklaring:
💲 Kræver konsulenttimer til opsætning og konfiguration
⭐ Gem som favorit og del med andre
FUNCTIONALITY
- Reports
- Planning
- Dashboard
Data Source
Marketplace Data Source: Filter by Data Source to find assets specific to your system
Showcase Data Source: Filter by Data Source to find assets specific to your system
Industries
Marketplace Industries: Filter by Industries to find assets specific to your system
Showcase Industries: Filter by Industries to find assets specific to your system
industries
Marketplace Industries: Filter by your industry to find assets created for your specific needs
Showcase Industries: Filter by your industry to find assets created for your specific needs
727 - 732 of 868 Results
Favorite Page Results
Favorites
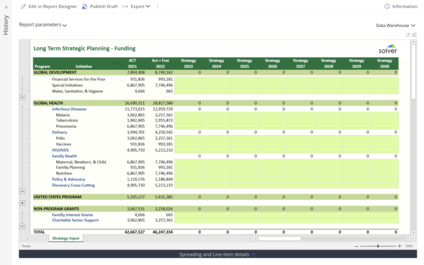


Planning
Nonprofit - Long Term Strategic Planning
Enables nonprofit executives and boards to build multi-year financial plans aligned with strategic goals in Solver. Supports long-range financial sustainability analysis.
$
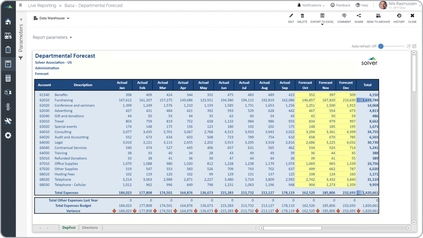
Planning
Nonprofit – Department Forecast
Key functionality input template retrieves year-to-date actual data for the chosen department and then provides input for the remaining periods of the year.
$
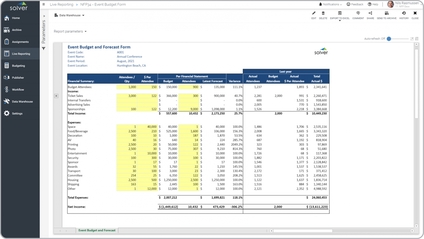
Planning
Nonprofit – Event Forecast
What are Event Budgeting and Forecasting Tools ? Key functionality input form allows the user to enter statistical metrics along with revenue and expense drivers for each event.
$
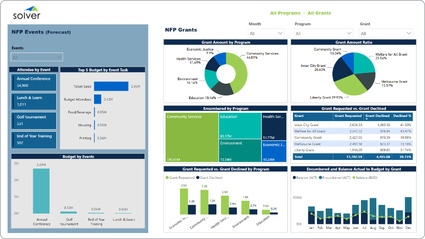
Dashboard
Nonprofit – Events and Grants Dashboard
It includes graphical analysis of nine different areas:. Top 5 event budget items,. Grant amount per program,.
$
Reports
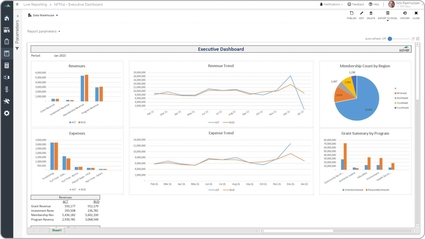
Nonprofit – Executive Dashboard
Some of the key functionality visual report is that it it provides a mix of graphical analysis as well as a report (partially visible at the bottom of the screenshot below).
$
Dashboard
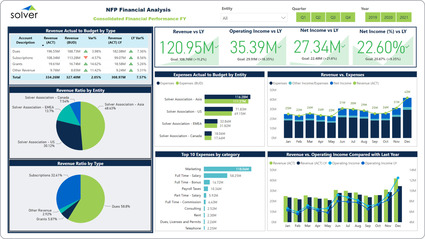
Nonprofit – Financial Dashboard
It provides analysis through eight different perspectives on the dashboard. Actual versus budget and Last Year variance analysis for revenues,.
$