

Solver-markedsplads
Udforsk efter funktionalitet (rapporter, planlægning og dashboard-skabeloner), eller brug søgefunktionen til at filtrere efter integration, branche eller for at finde en skabelon, der passer til dine specifikke behov. Gem skabeloner på din favoritliste, og brug linket »Del favoritter« til at dele listen med andre.
Ikonforklaring:
💲 Kræver konsulenttimer til opsætning og konfiguration
⭐ Gem som favorit og del med andre
FUNCTIONALITY
- Reports
- Planning
- Dashboard
Data Source
Marketplace Data Source: Filter by Data Source to find assets specific to your system
Showcase Data Source: Filter by Data Source to find assets specific to your system
Industries
Marketplace Industries: Filter by Industries to find assets specific to your system
Showcase Industries: Filter by Industries to find assets specific to your system
industries
Marketplace Industries: Filter by your industry to find assets created for your specific needs
Showcase Industries: Filter by your industry to find assets created for your specific needs
661 - 666 of 868 Results
Favorite Page Results
Favorites


Reports
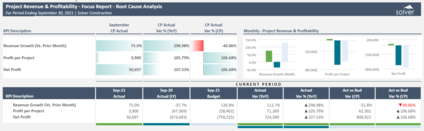
Construction - KPI - Focus Report - Project Revenue & Profitability
Analyzes project revenue and profitability against contract value and budget. Enables construction project managers and CFOs to monitor margin health and take corrective action.
$
Reports
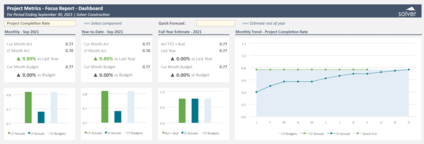
Construction - KPI - Focus Report - Project Metrics
Tracks key project performance metrics including percent complete, burn rate, and remaining budget versus estimate. Helps construction teams manage project health and delivery timelines.
$
Reports
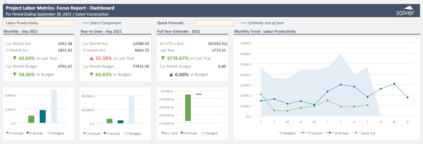
Construction - KPI - Focus Report - Project Labor Metrics
Analyzes labor hours, costs, and productivity by project and trade. Supports workforce planning and labor cost management across construction operations.
$
Reports
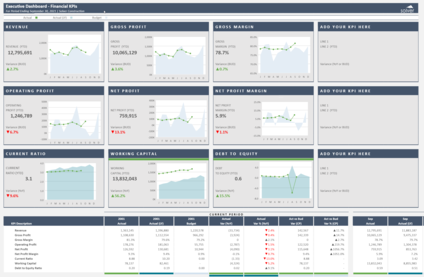
Construction - Dashboard Financial KPIs
Tile-style Power BI dashboard displaying key financial KPIs for construction executives including revenue, costs, and margin. Designed for clear, concise snapshot reporting.
$
Reports
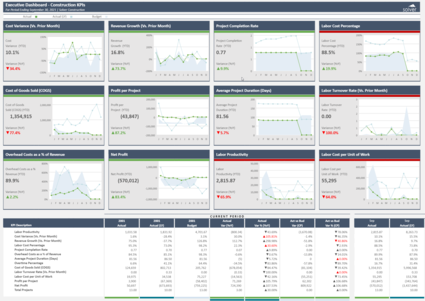
Construction - Dashboard - Construction KPIs
Displays construction-specific operational KPIs including project completion rates, labor productivity, and equipment utilization. Supports operational decision-making for project managers.
$
Reports
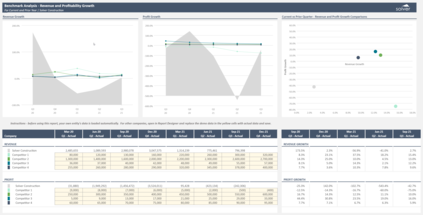
Construction - Dashboard Benchmark Analysis
Compares project financial and operational KPIs across the portfolio in a benchmark view. Helps construction executives identify top-performing projects and replicate best practices.
$