

Solver-markedsplads
Udforsk efter funktionalitet (rapporter, planlægning og dashboard-skabeloner), eller brug søgefunktionen til at filtrere efter integration, branche eller for at finde en skabelon, der passer til dine specifikke behov. Gem skabeloner på din favoritliste, og brug linket »Del favoritter« til at dele listen med andre.
Ikonforklaring:
💲 Kræver konsulenttimer til opsætning og konfiguration
⭐ Gem som favorit og del med andre
FUNCTIONALITY
- Reports
- Planning
- Dashboard
Data Source
Marketplace Data Source: Filter by Data Source to find assets specific to your system
Showcase Data Source: Filter by Data Source to find assets specific to your system
Industries
Marketplace Industries: Filter by Industries to find assets specific to your system
Showcase Industries: Filter by Industries to find assets specific to your system
industries
Marketplace Industries: Filter by your industry to find assets created for your specific needs
Showcase Industries: Filter by your industry to find assets created for your specific needs
601 - 606 of 868 Results
Favorite Page Results
Favorites


Reports
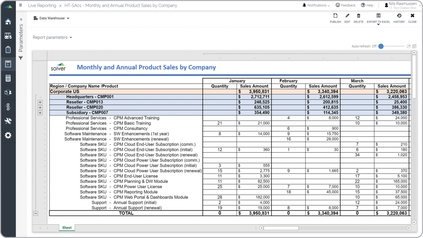
Tech – Monthly Product Sales
It displays January through December across the columns and shows both quantity and amount for each month.
$
Reports
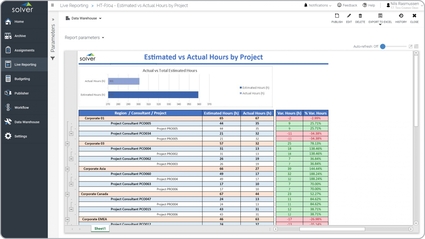
Tech – Project Hours Analysis
It is parameter driven and can be run for any month, entity and project(s).
$
Reports
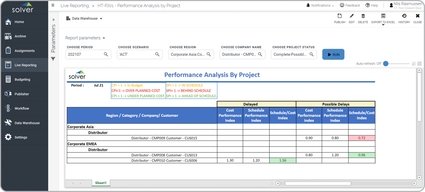
Tech – Project Performance
It tracks projects with a score for Delays or Possible Delays. Within these two areas, the report scores both the related cost and the scheduling.
$
Dashboard
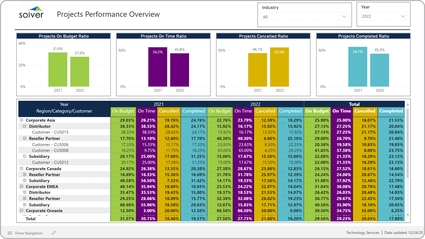
Tech – Project Performance Overview
It provides KPI analysis from five different perspectives. Percent of projects on budget with comparison to prior year,. Percent of projects on time with prior year comparison,.
$
Reports
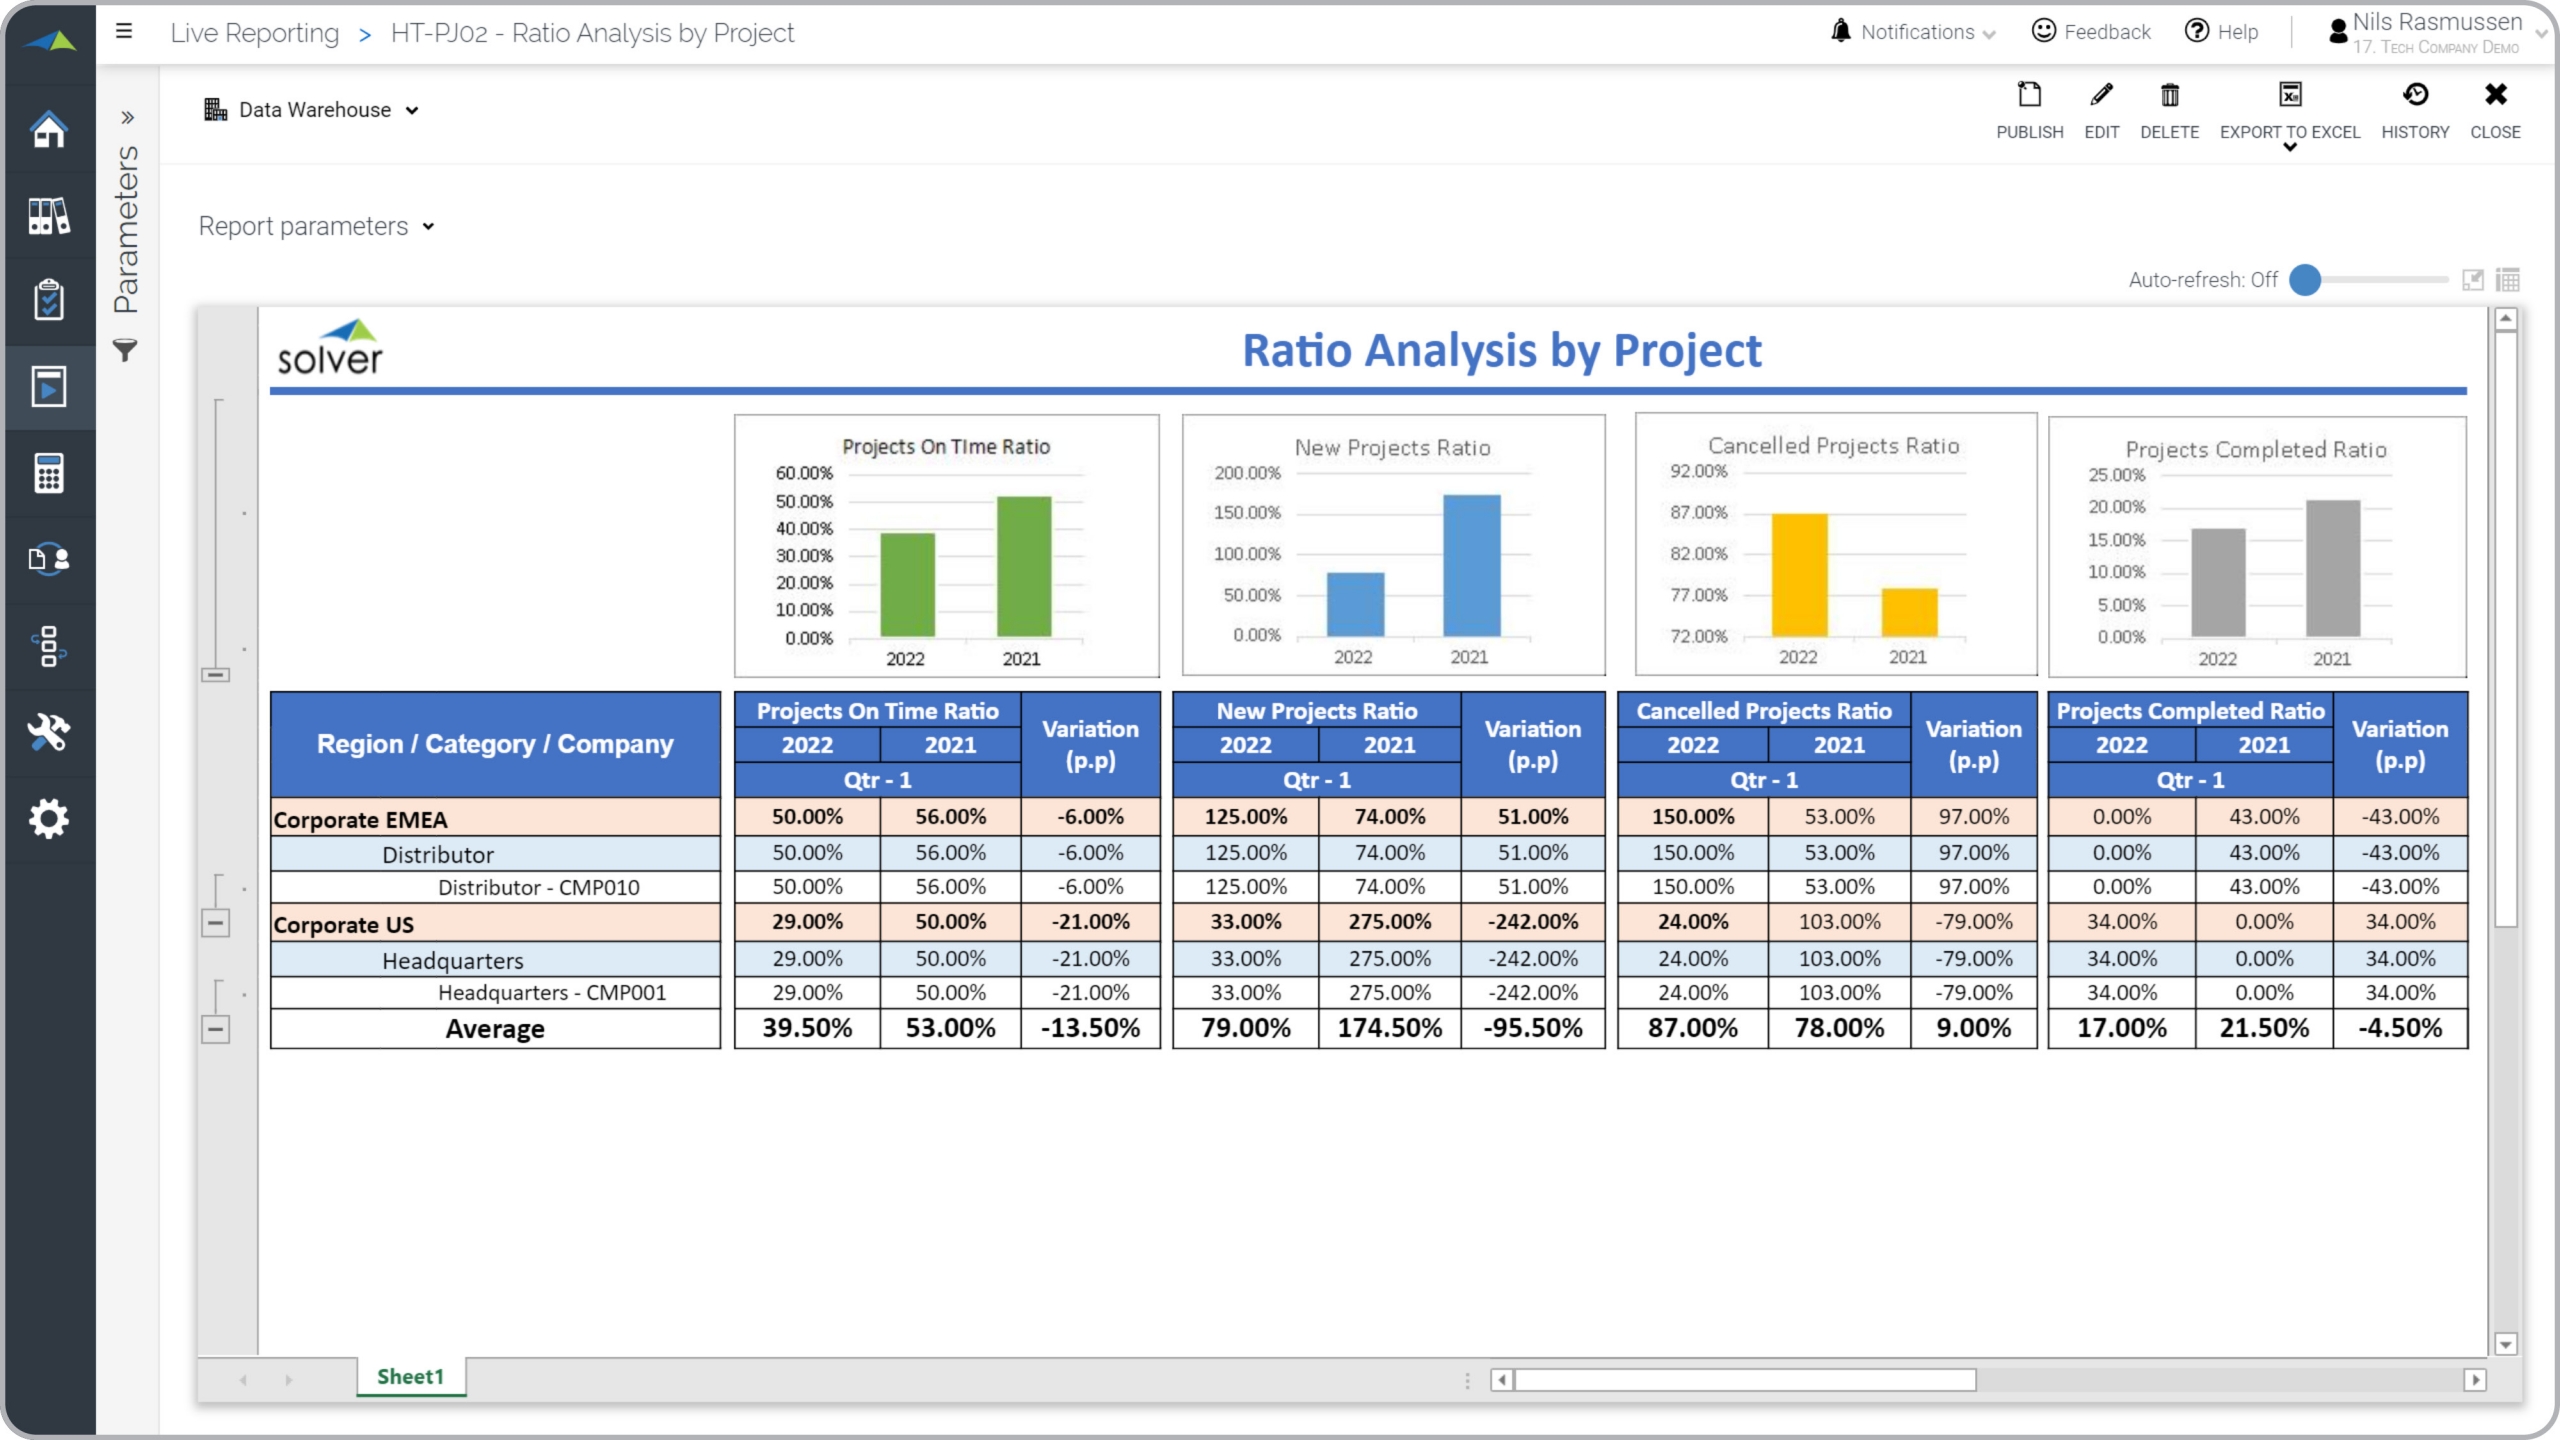
Tech – Project Status Analysis
It provides a year-over-year comparison of four metrics, including charts.
$
Planning
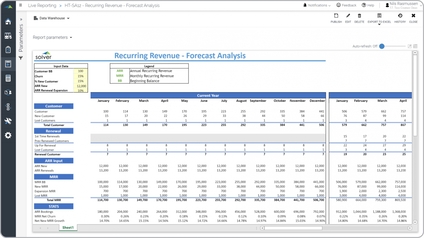
Tech – Recurring Revenue Forecast
Some of the key functionality model is that it can both be used to create forecasts and budgets, and it can be used for what-if modelling without storing the resulting data.
$