

Solver-markedsplads
Udforsk efter funktionalitet (rapporter, planlægning og dashboard-skabeloner), eller brug søgefunktionen til at filtrere efter integration, branche eller for at finde en skabelon, der passer til dine specifikke behov. Gem skabeloner på din favoritliste, og brug linket »Del favoritter« til at dele listen med andre.
Ikonforklaring:
💲 Kræver konsulenttimer til opsætning og konfiguration
⭐ Gem som favorit og del med andre
FUNCTIONALITY
- Reports
- Planning
- Dashboard
Data Source
Marketplace Data Source: Filter by Data Source to find assets specific to your system
Showcase Data Source: Filter by Data Source to find assets specific to your system
Industries
Marketplace Industries: Filter by Industries to find assets specific to your system
Showcase Industries: Filter by Industries to find assets specific to your system
industries
Marketplace Industries: Filter by your industry to find assets created for your specific needs
Showcase Industries: Filter by your industry to find assets created for your specific needs
55 - 60 of 868 Results
Favorite Page Results
Favorites
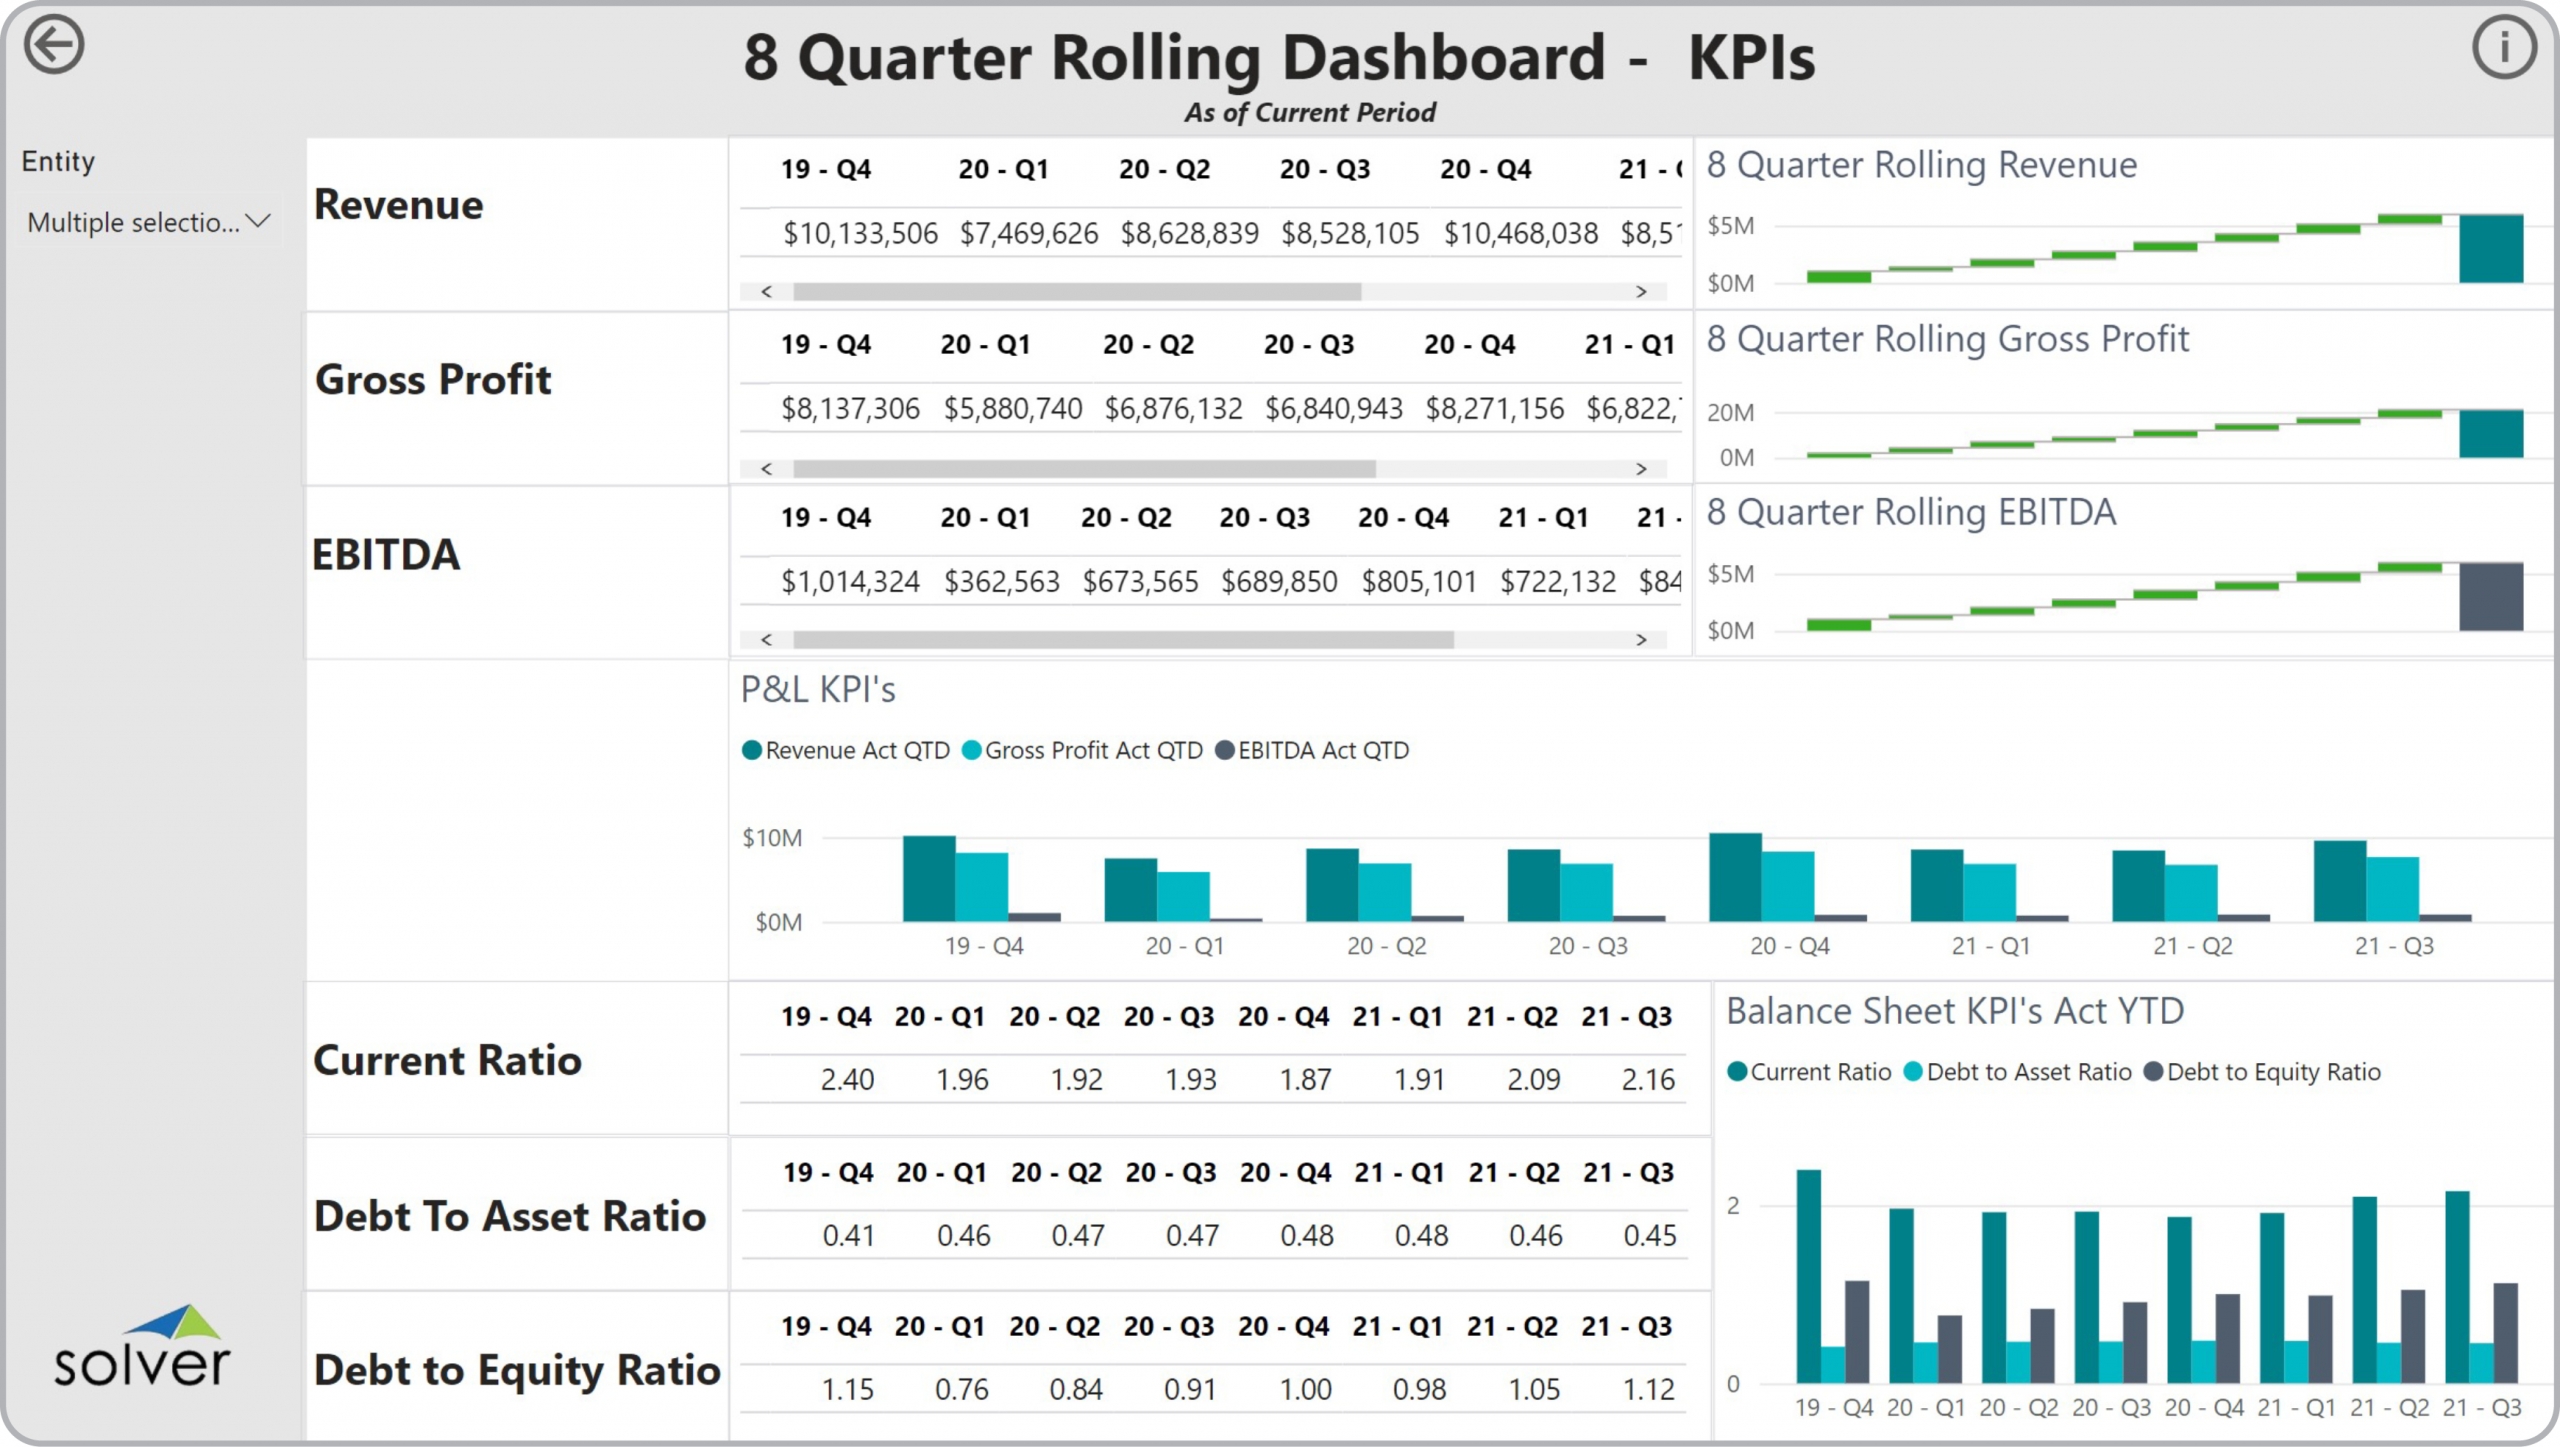


Dashboard
GL Dashboard – 8 Quarter KPI Trend
It gives CFOs, FP&A managers, and business unit leaders fast, reliable access to the financial and operational insights they need — without custom development.
$
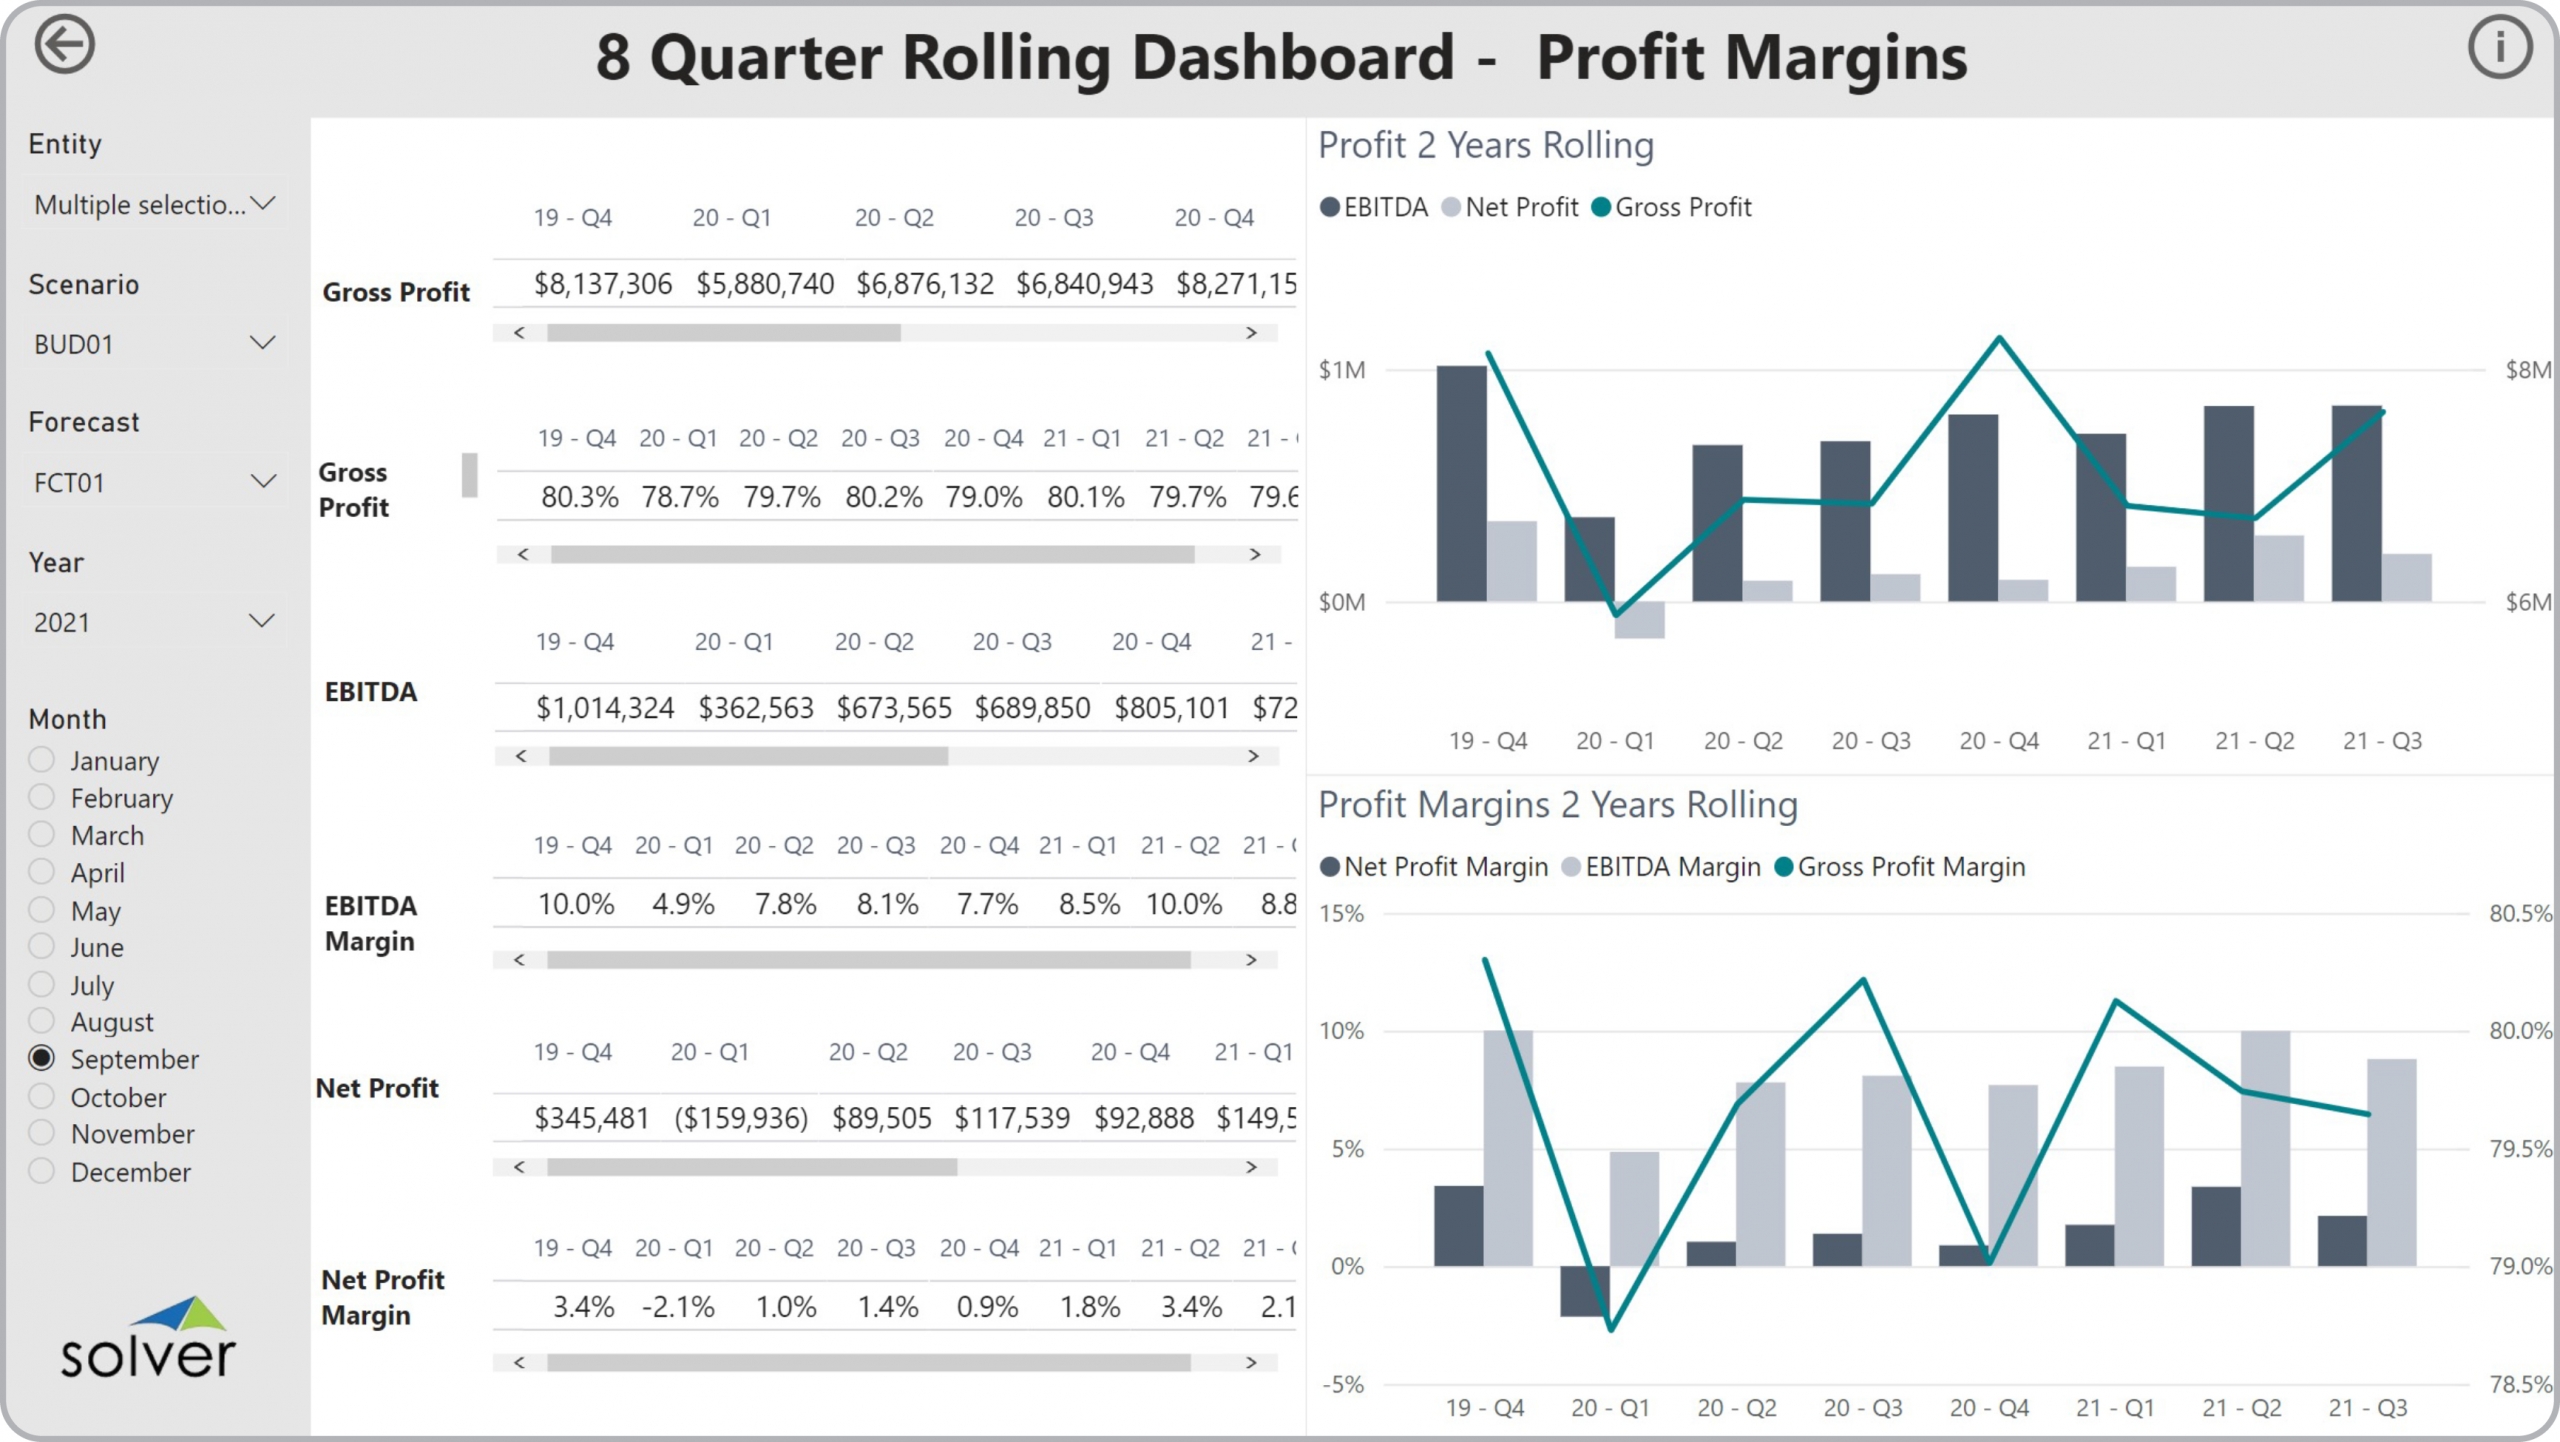
Dashboard
GL Dashboard – 8 Quarter Profitability Trend
It gives CFOs, FP&A managers, and business unit leaders fast, reliable access to the financial and operational insights they need — without custom development.
$
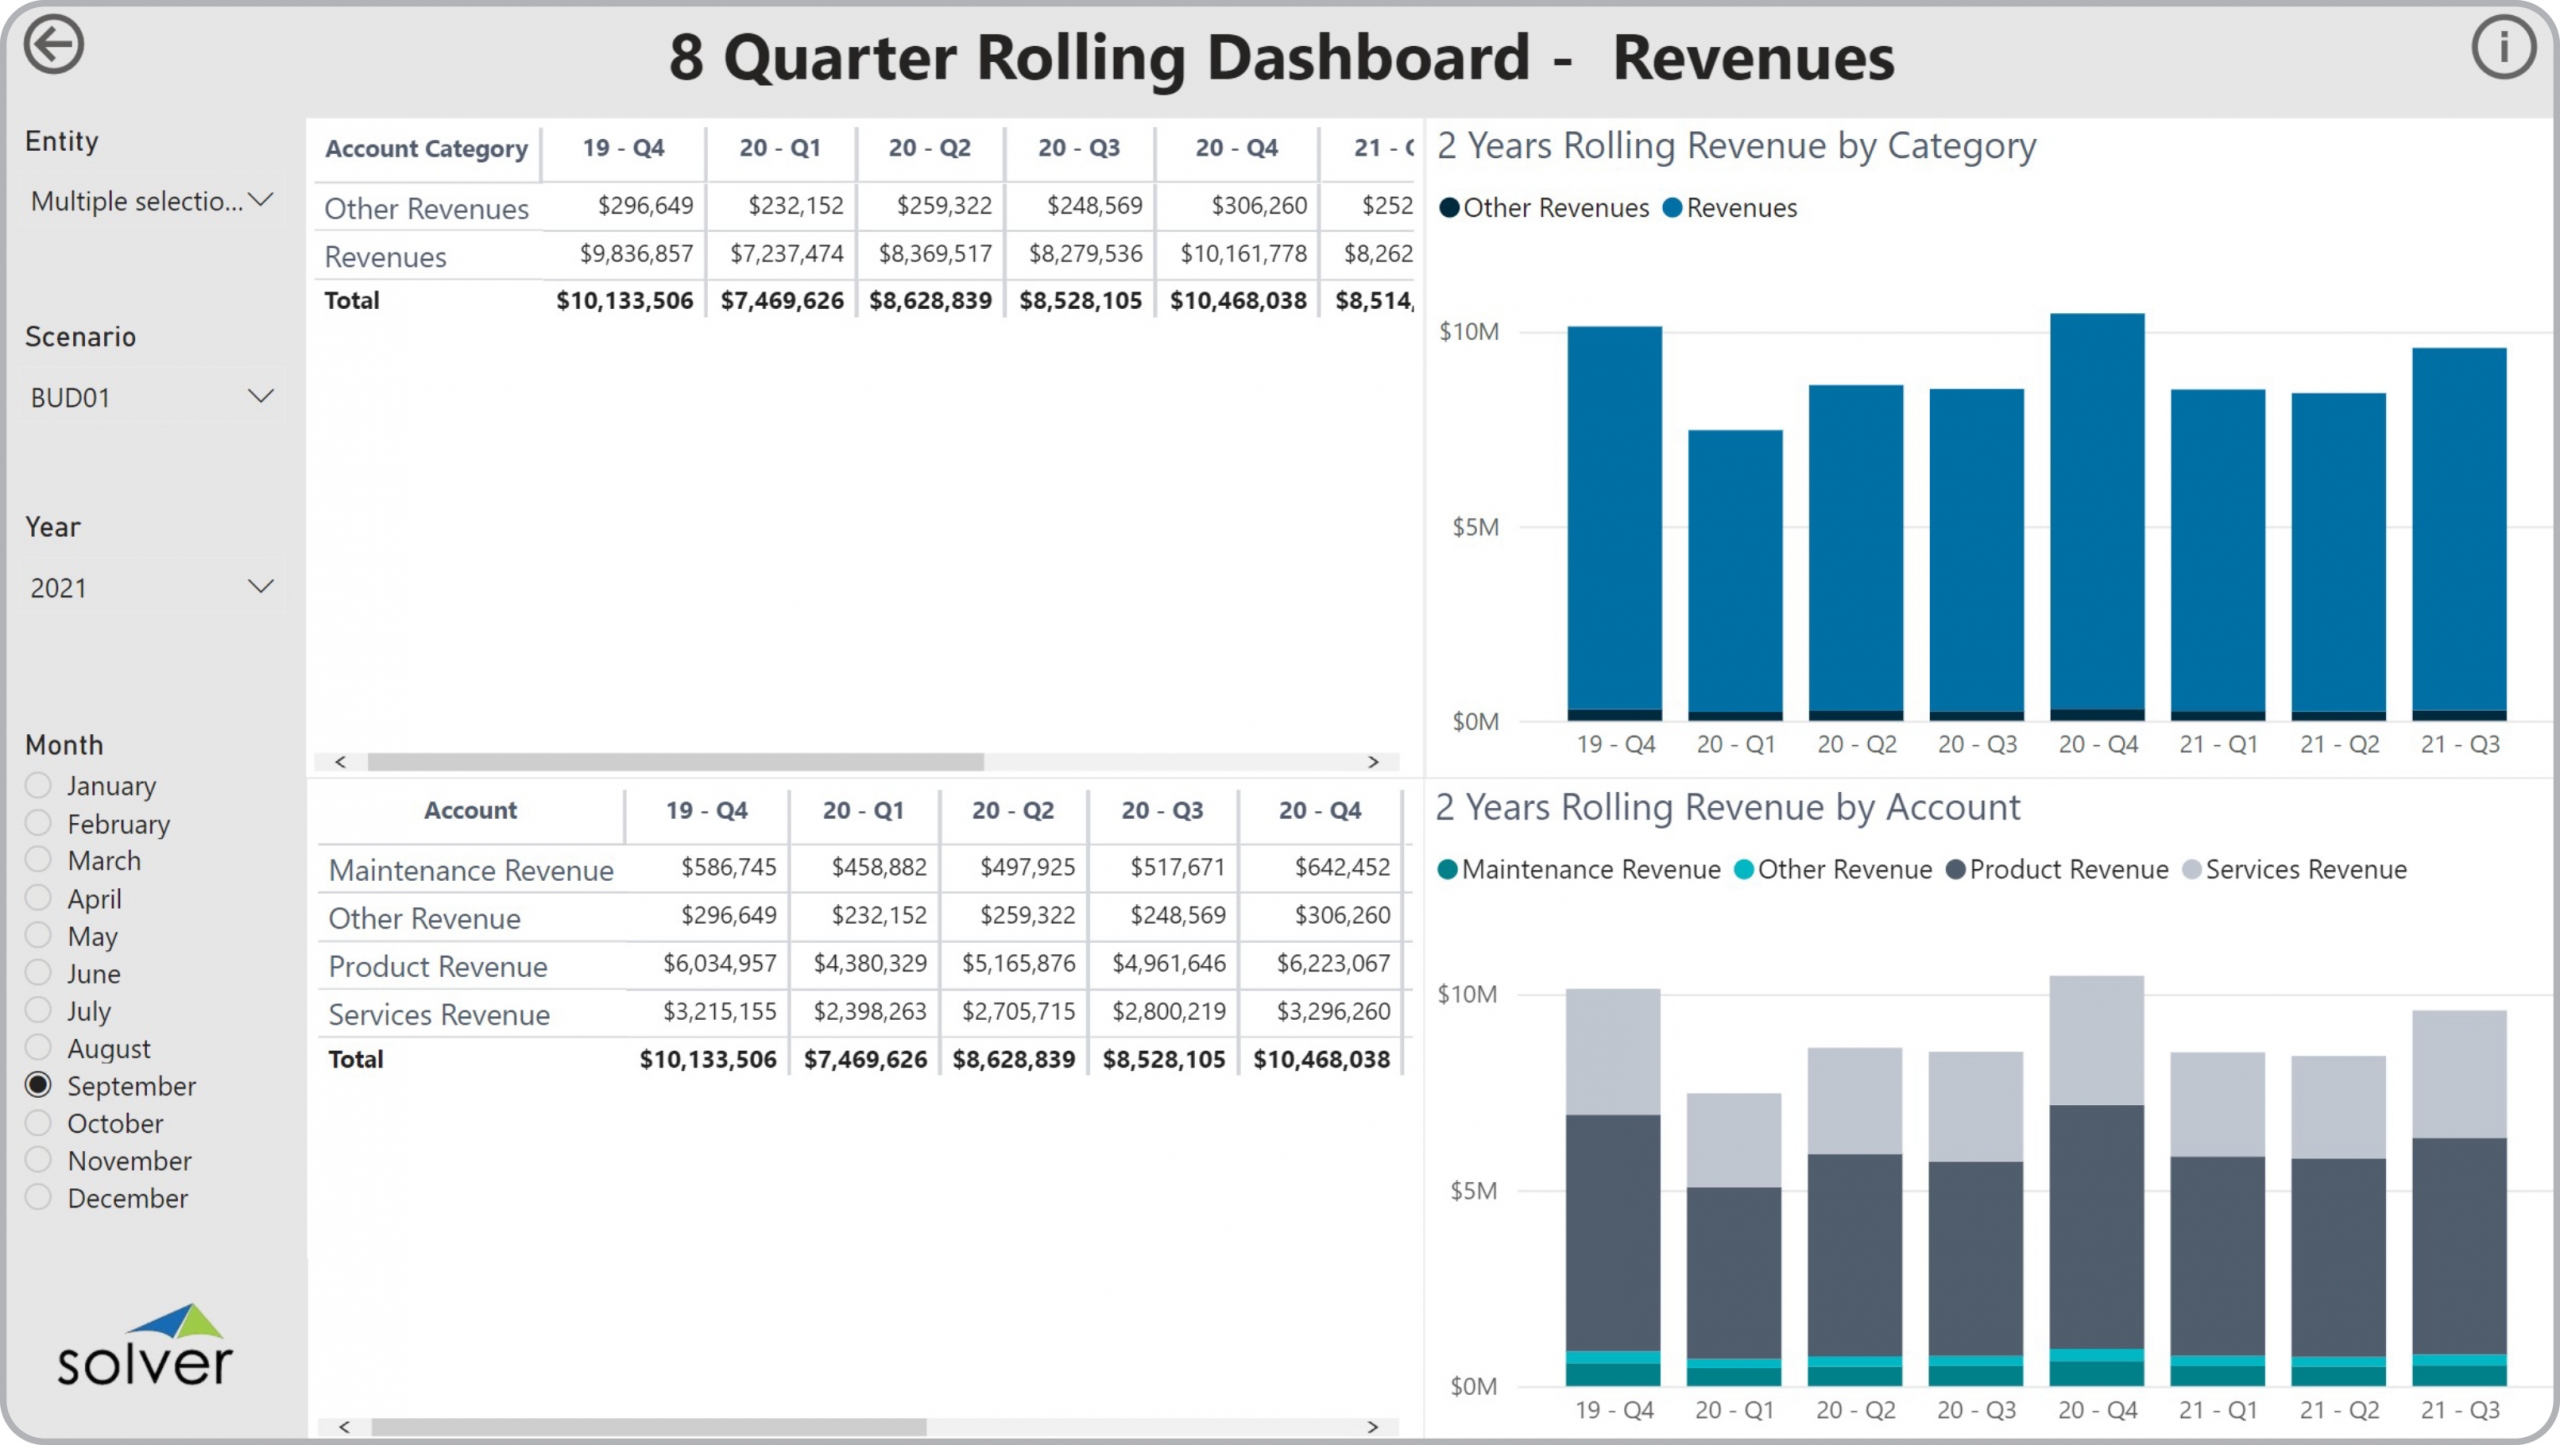
Dashboard
GL Dashboard – 8 Quarter Revenue Trend
It gives CFOs, FP&A managers, and business unit leaders fast, reliable access to the financial and operational insights they need — without custom development.
$
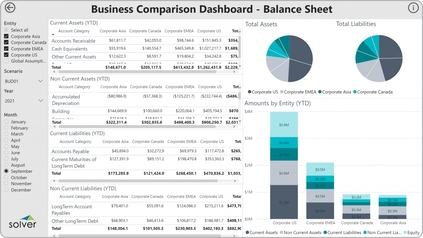
Dashboard
GL Dashboard – Business Comparison – Balance Sheet
It gives CFOs, FP&A managers, and business unit leaders fast, reliable access to the financial and operational insights they need — without custom development.
$
Dashboard
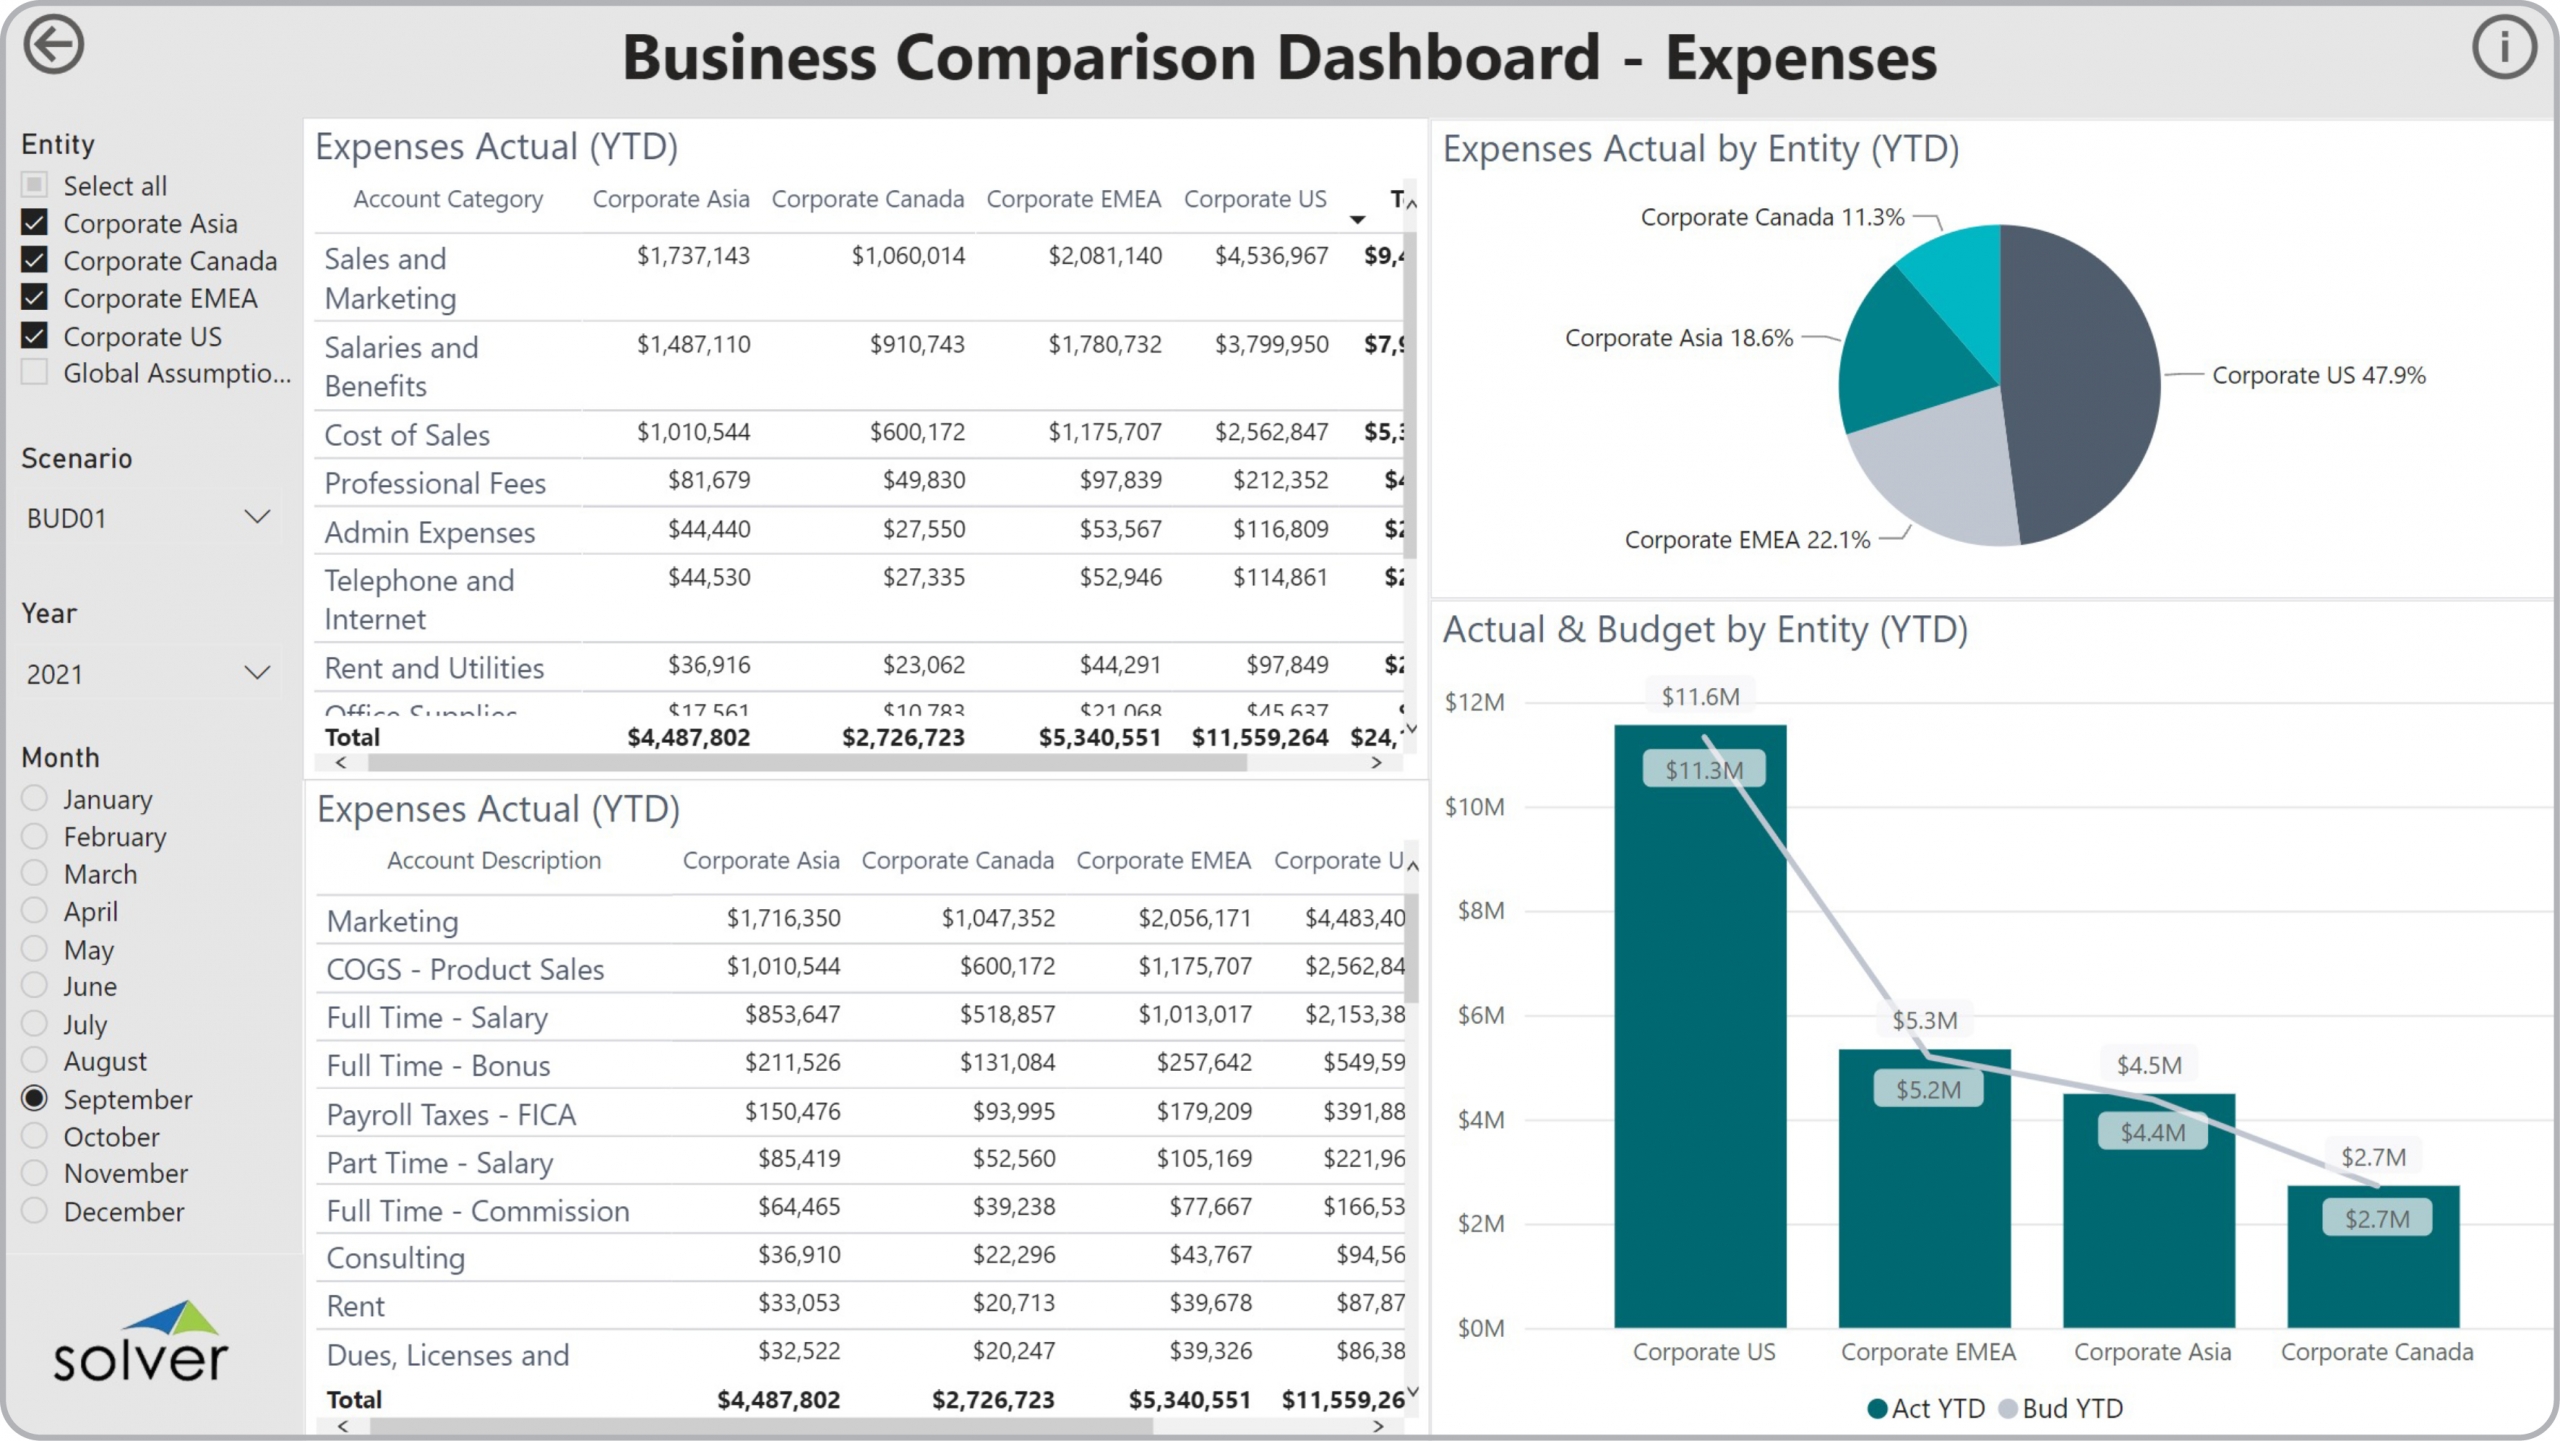
GL Dashboard – Business Comparison – Expenses
Expense Comparison Dashboards to Streamline the Monthly Reporting and Consolidations Process
$
Dashboard
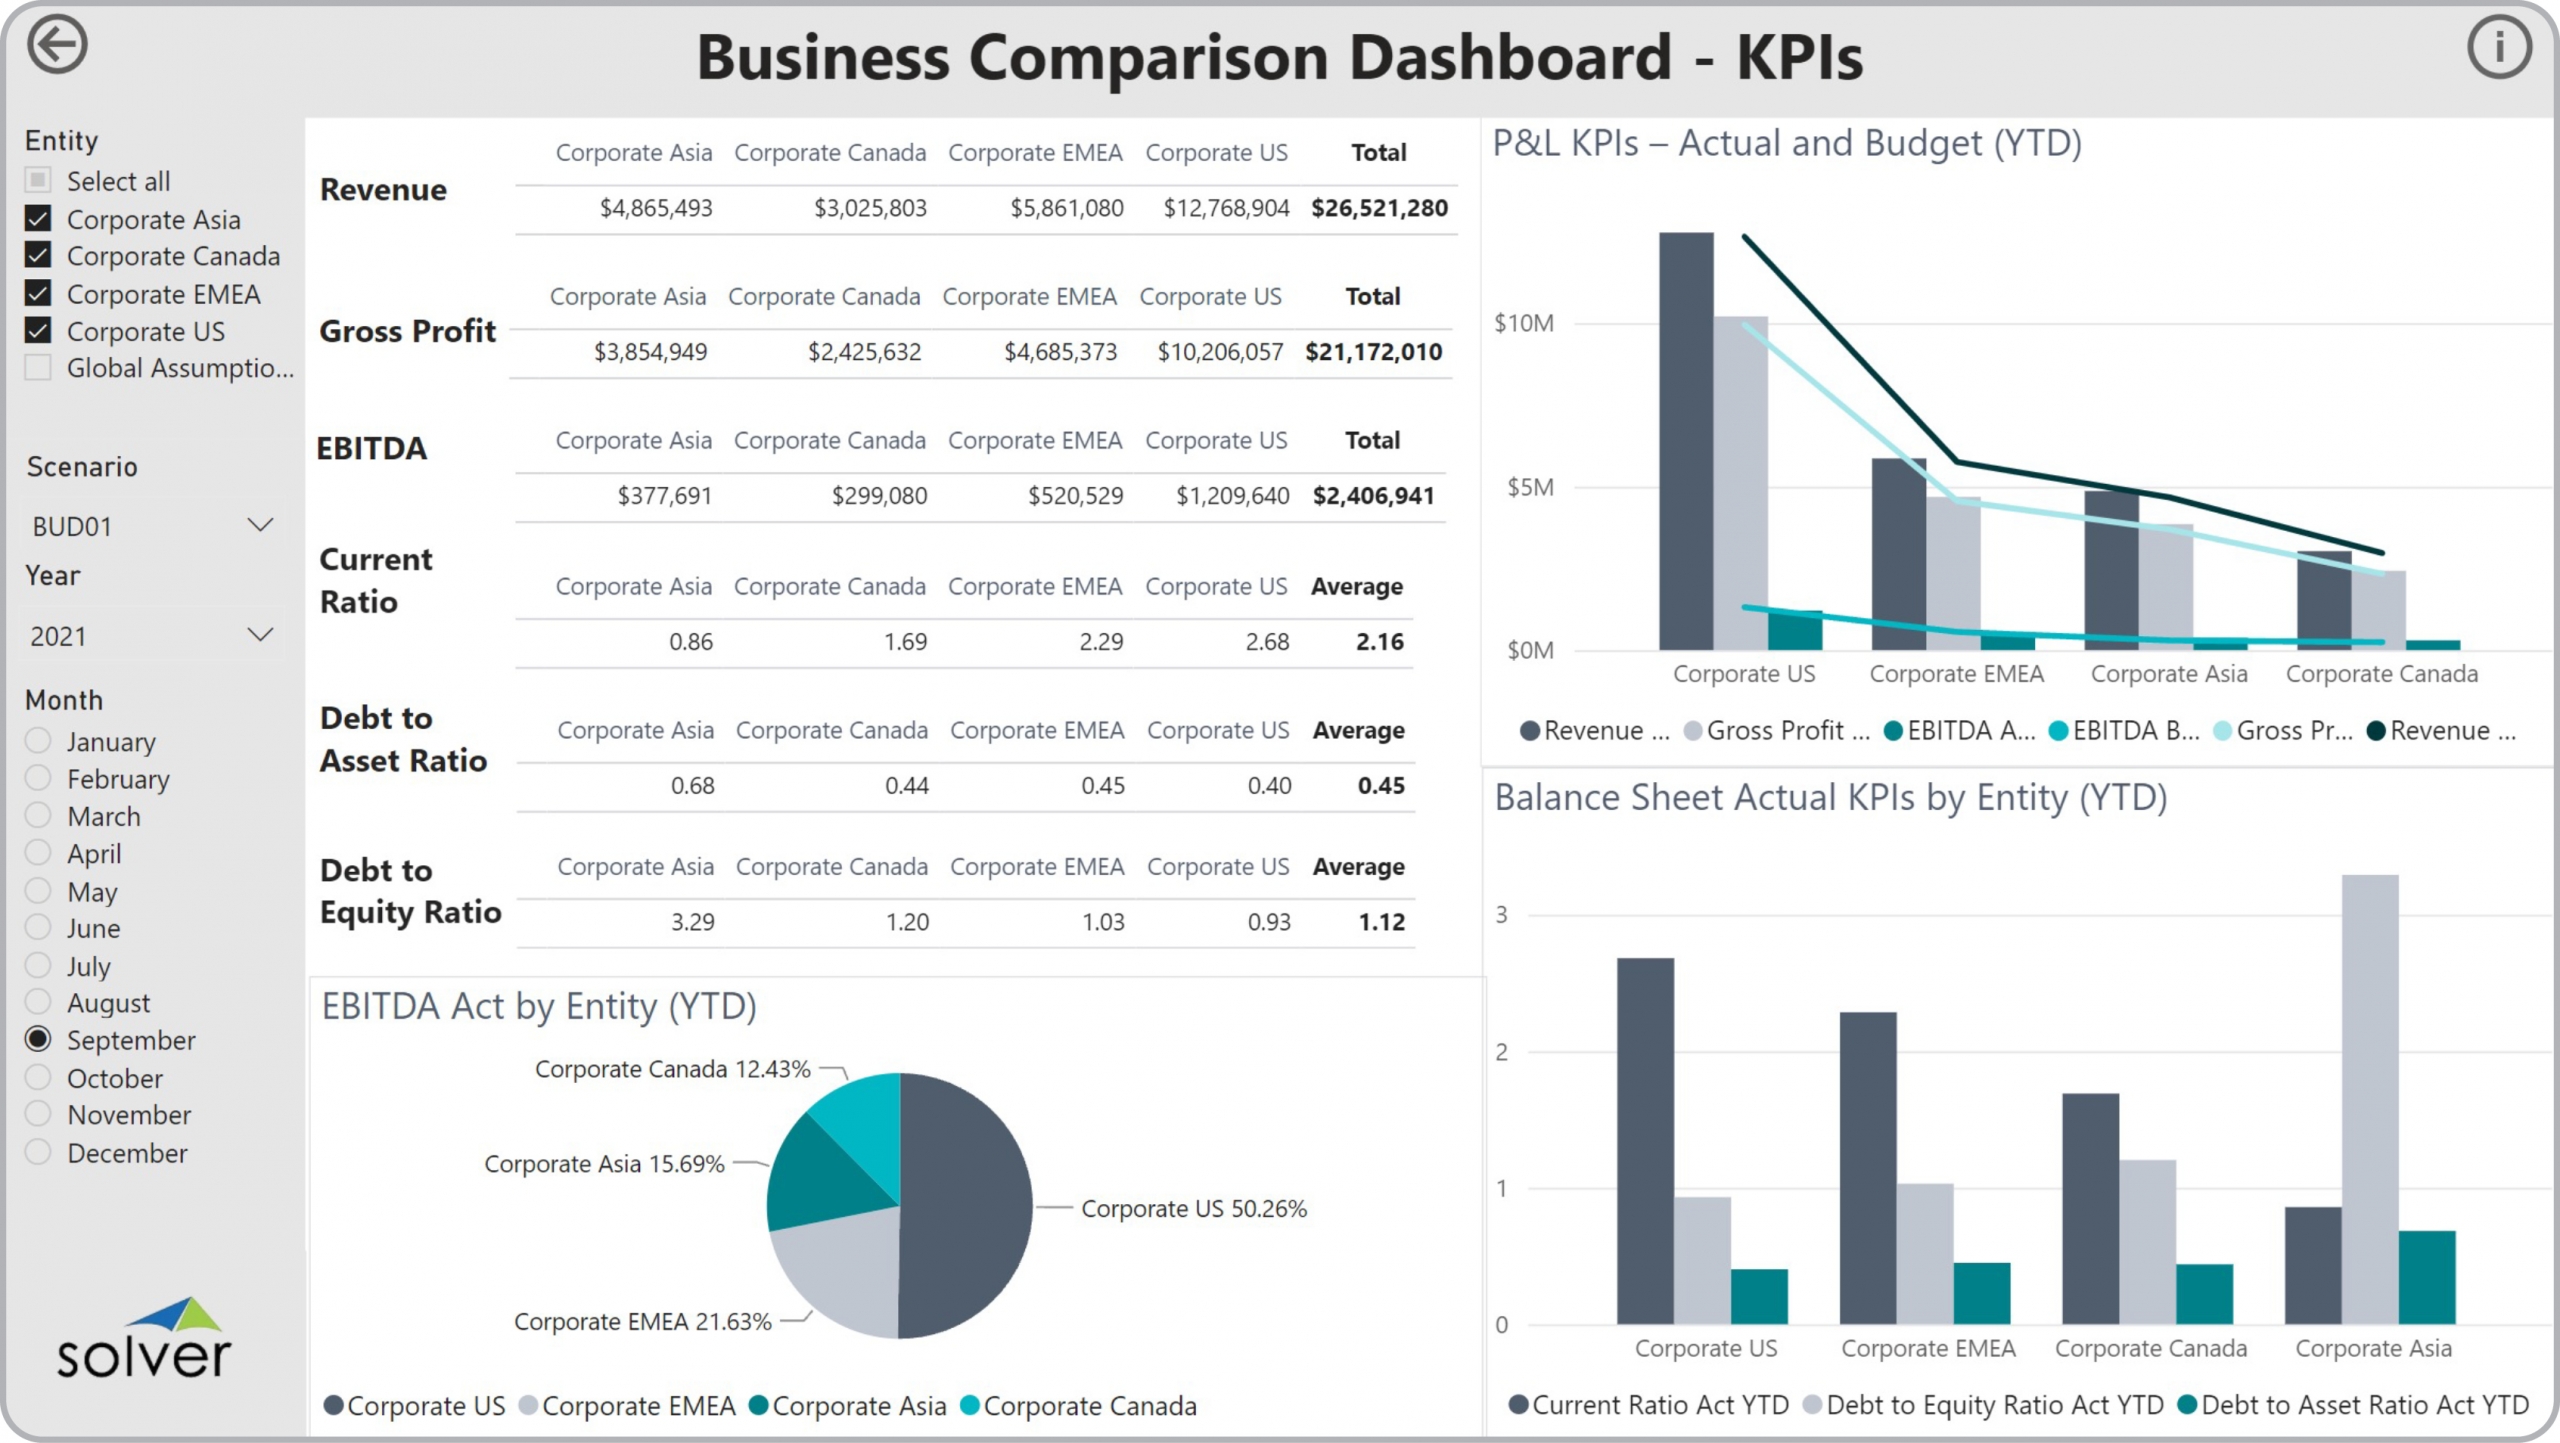
GL Dashboard – Business Comparison – KPIs
It gives CFOs, FP&A managers, and business unit leaders fast, reliable access to the financial and operational insights they need — without custom development.
$