
Tech – YTD Sales Trend
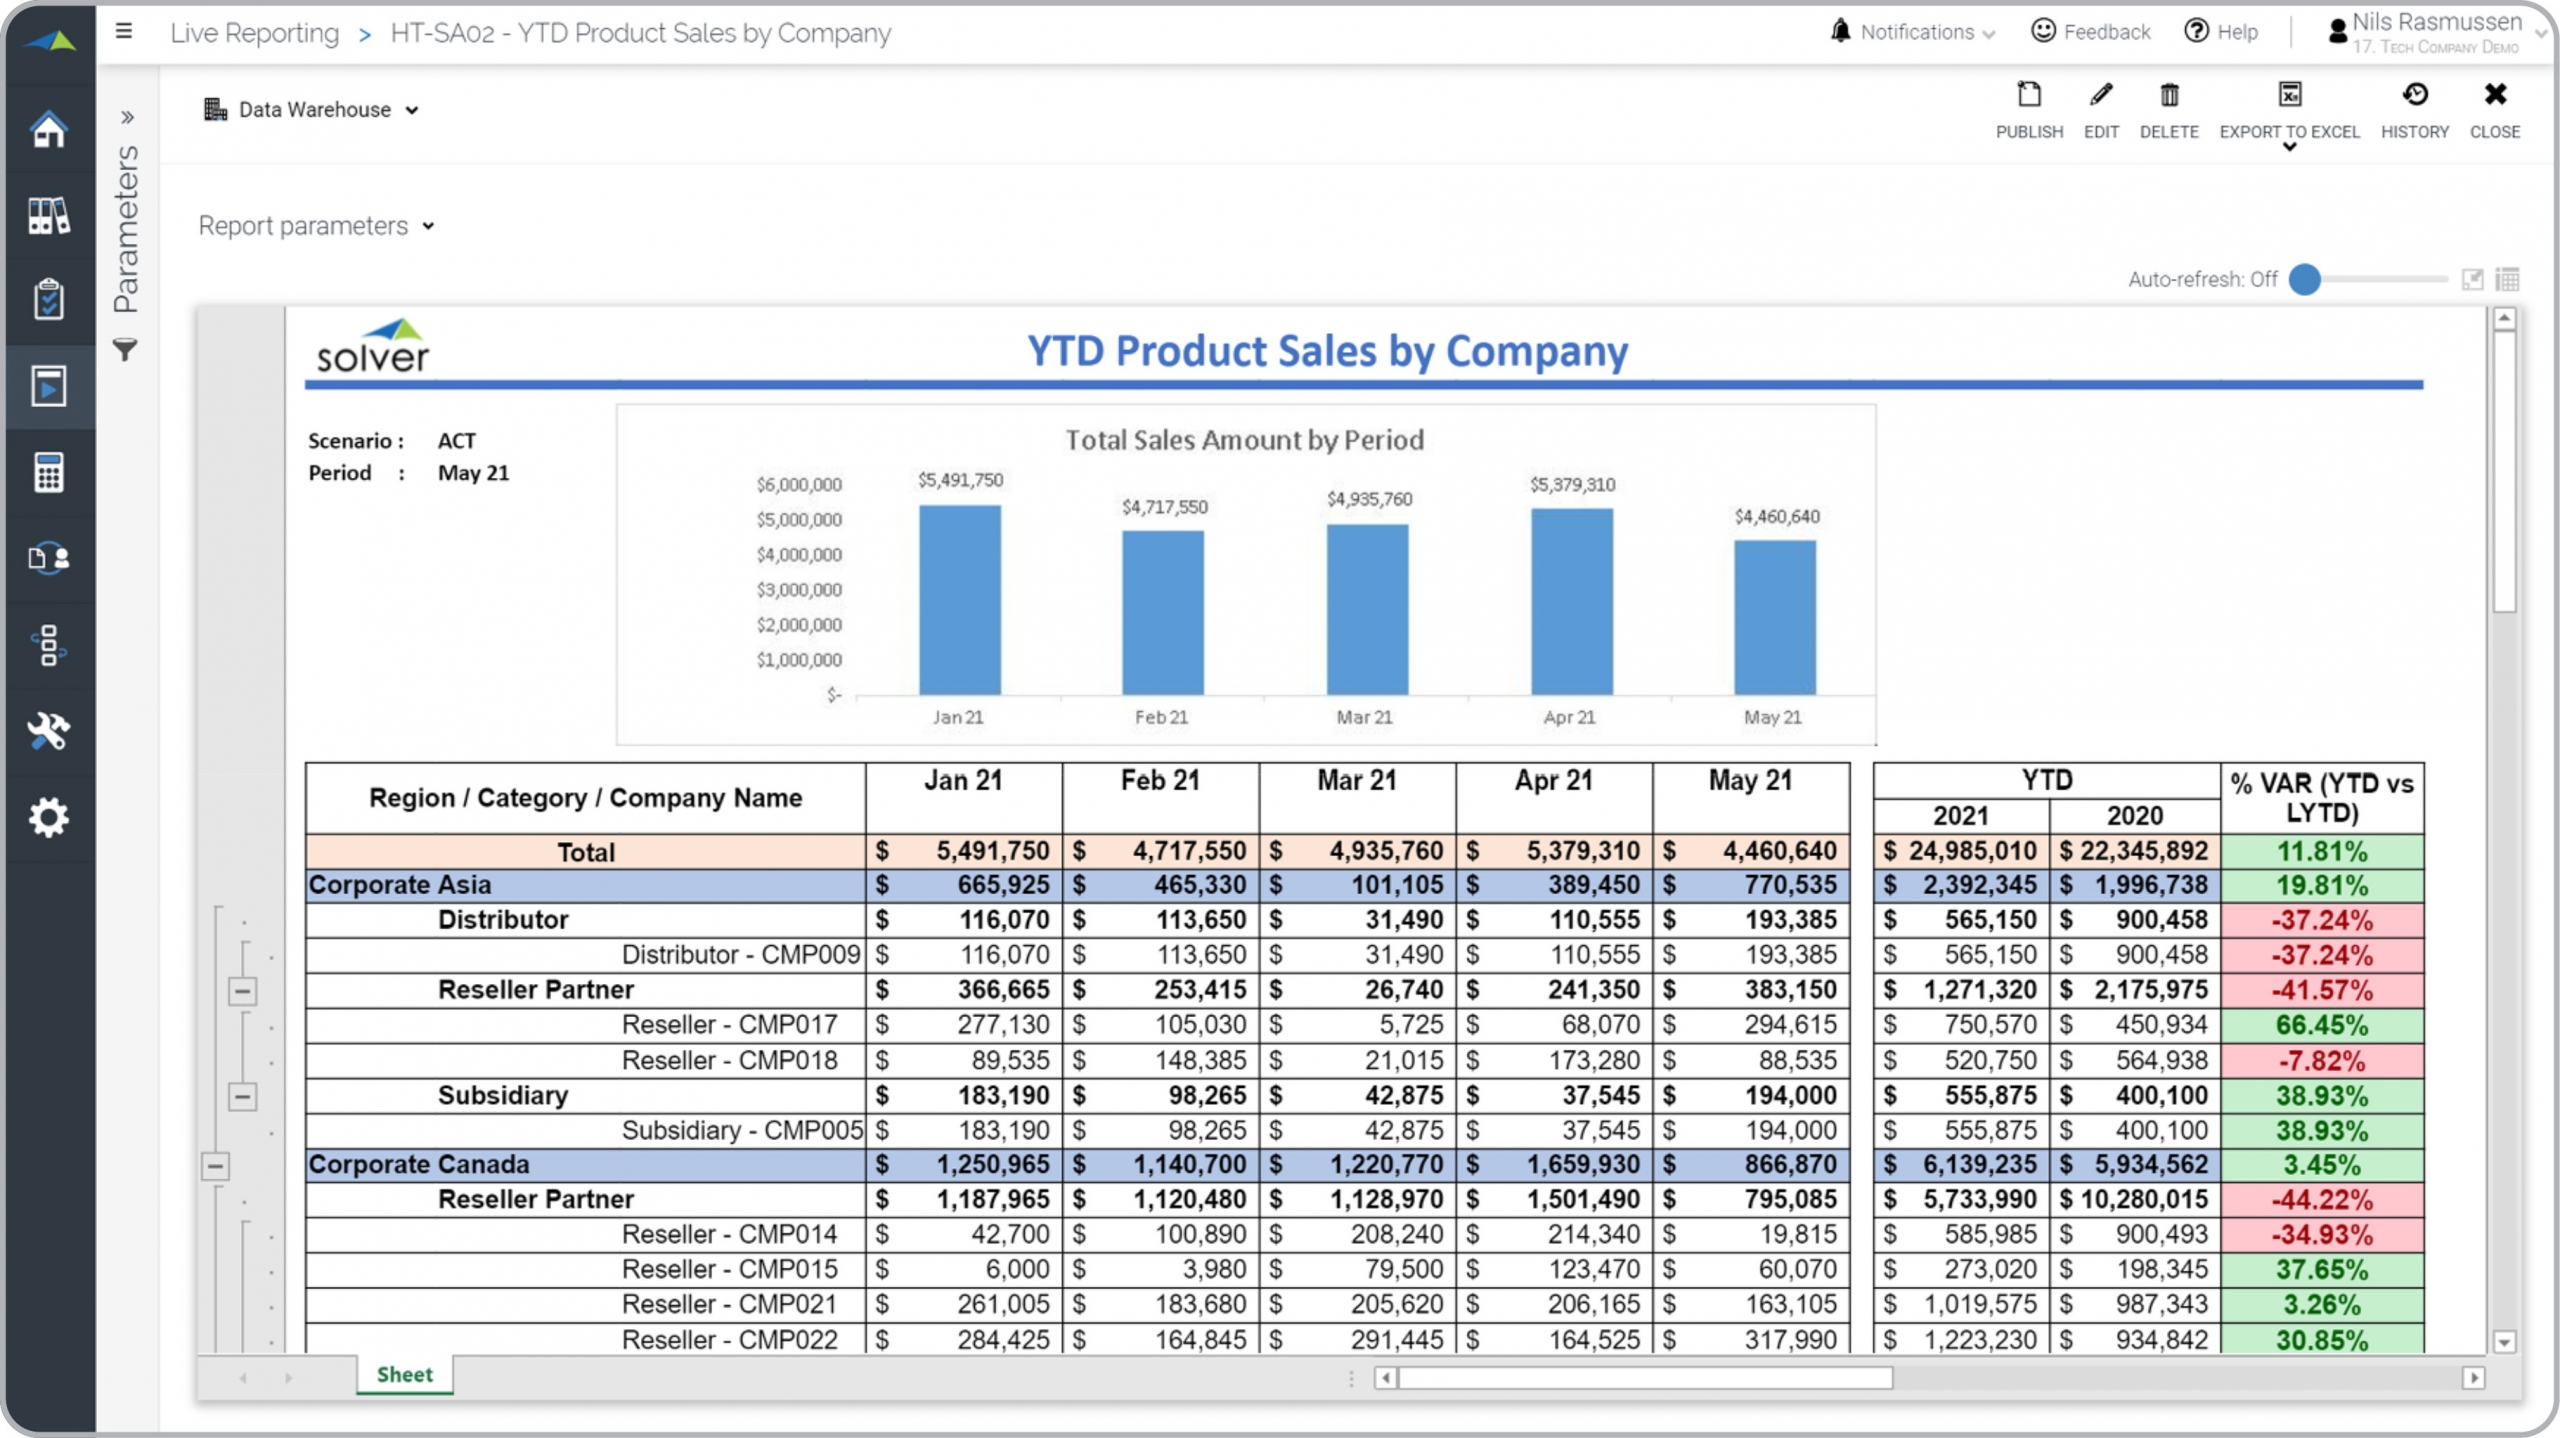
What is a Monthly Sales Trend Report? Monthly sales reports are considered trend analysis tools and are used by sales managers and executives to track sales by channel by month. Some of the main functionality in this type of report is that it automatically displays sales for each month up to the current period. The rows show sales by channel (direct, distributor, reseller) with roll-ups and totals by region. On the right side the report compares the year-to-date (YTD) sales against last year with a percent variance and color highlighting of positive and negative variances. The chart on the top of the report shows aggregate monthly sales. You find an example of this type of report below.
Purpose of Monthly Sales Trend Reports Technology companies use Monthly Sales Trend Reports to monitor trends and exceptions in sales as well as to compare performance across their channels. When used as part of good business practices in Sales departments, a company can improve its revenues by optimizing tactical sales decisions, and it can reduce the chances that weak performance in any area goes undetected.
Who Uses This Type of Report? The typical users of this type of report are: Budget Managers, Revenue Officers, Sales Executives, Regional Managers. Other Reports Often Used in Conjunction with Monthly Sales Trend Reports Progressive Sales departments sometimes use several different Monthly Sales Trend Reports, along with detailed sales reports, sales dashboards, budget models, sales forecasts, open and paid sales orders reports and other management and control tools.
Where Does the Data for Analysis Originate From? The Actual (historical transactions) data typically comes from enterprise resource planning (ERP) systems like: Microsoft Dynamics 365 (D365) Finance, Microsoft Dynamics 365 Business Central (D365 BC), Microsoft Dynamics AX, Microsoft Dynamics NAV, Microsoft Dynamics GP, Microsoft Dynamics SL, Sage Intacct, Sage 100, Sage 300, Sage 500, Sage X3, SAP Business One, SAP ByDesign, Acumatica, Netsuite and others. In analyses where budgets or forecasts are used, the planning data most often originates from in-house Excel spreadsheet models or from professional xFP&A solutions.
Built for technology finance teams and aligned with Solver's xFP&A platform, this Solver report template connects directly to your ERP data via the Solver Data Warehouse, enabling near real-time analysis with minimal setup. Designed for QuickStart deployment, it can be activated rapidly so your team can focus on analysis and decisions — not data preparation.
What is the Tech – YTD Sales Trend in Solver? The Tech – YTD Sales Trend is a pre-built xFP&A report template in Solver designed for technology organizations. It delivers key financial and operational metrics in a single, easy-to-use interface — purpose-built for technology finance workflows.
Who uses this Solver report template? This template is primarily used by CFOs, FP&A managers, and technology finance teams in technology organizations who need accurate, timely data to support planning, reporting, and decision-making. It is particularly valuable for technology finance teams managing budgets, forecasts, and performance reviews.
Where does the data come from? Data is sourced automatically from your ERP system through the Solver Data Warehouse, which integrates with platforms such as Microsoft Dynamics 365 Business Central, Dynamics 365 Finance, Acumatica, Sage Intacct, and other leading ERP solutions. Salesforce and subscription billing systems such as Binary Stream can also be connected for unified SaaS and technology metrics. Once connected, the template updates in near real-time with no manual data entry required.
To learn more, visit the Resource Library.