
Tech – Project Performance
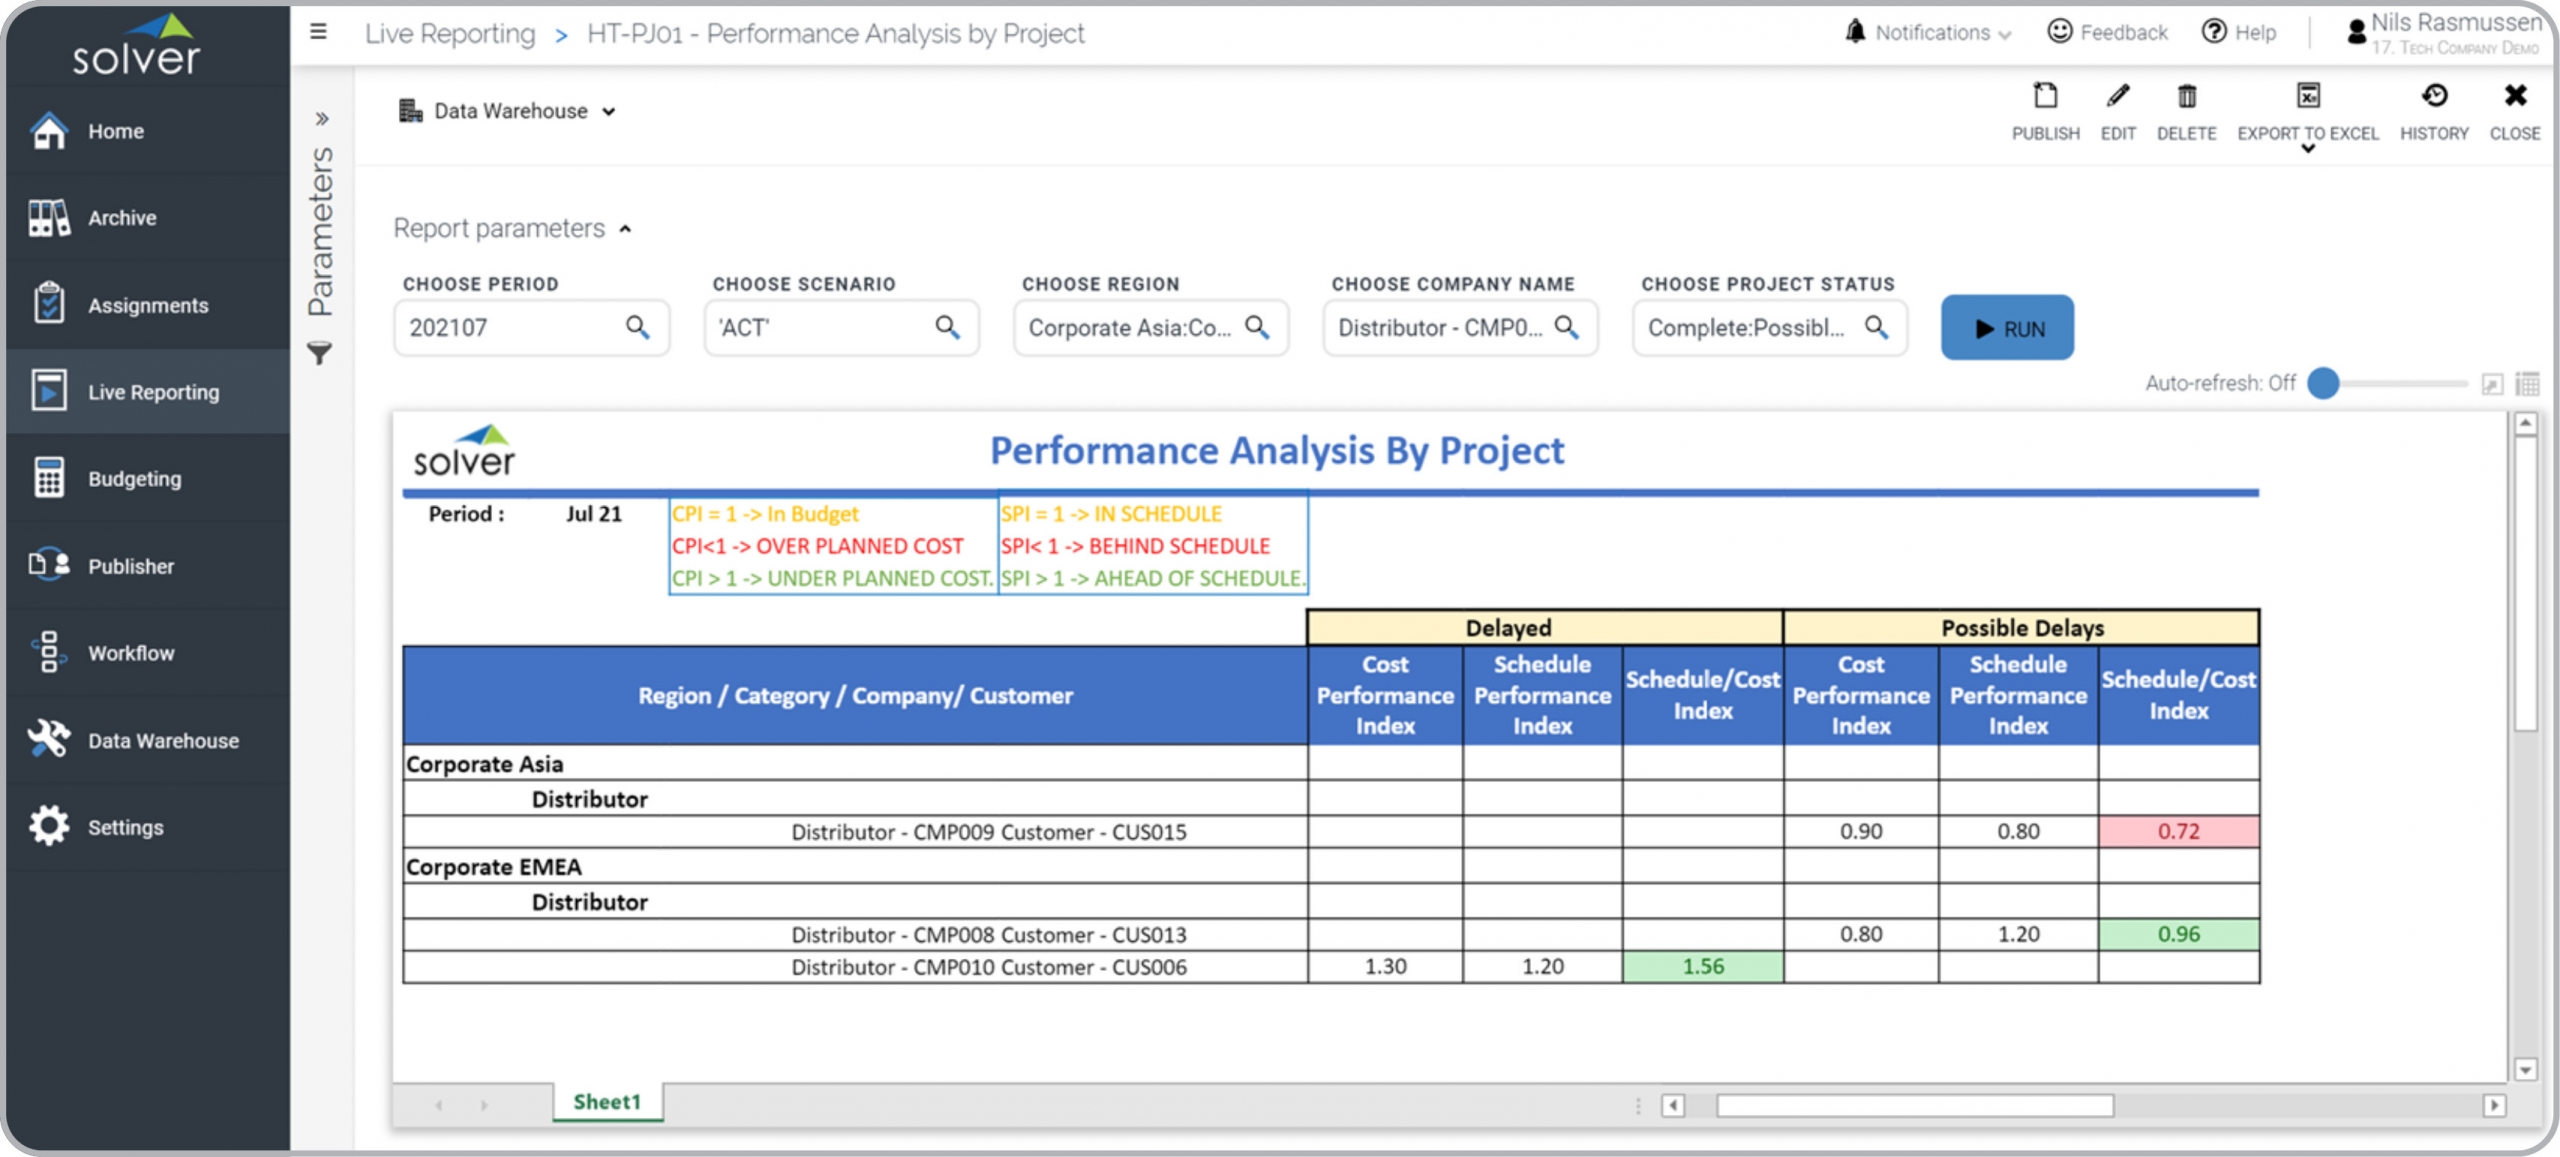
What is a Project Performance Report? Project performance reports are considered operational analysis tools and are often used by managers to score, compare and analyze projects as it relates to current and potential delays. Some of the key functionality in this type of report is that it tracks projects with a score for Delays or Possible Delays. Within these two areas, the report scores both the related cost and the scheduling. Figures and color codes show if a project cost is over, under, or on budget, and if a schedule is behind, ahead or on target. The report can be filtered for any number of customers, locations and project categories. You find an example of this type of report below.
Purpose of Project Performance Reports Companies use Project Performance Reports to optimize their ability to manage projects. When used as part of good business practices in a Project Management department, a company can improve its profitability and margins as well as reduce the chances that poor project delays are not consistently traced back to the main causes.
Who Uses This Type of Report? The typical users of this type of report are: Project Management Offices (PMO), Directors of Services, Consulting Managers. Other Reports Often Used in Conjunction with Project Performance Reports Progressive Project Management Departments sometimes use several different Project Performance Reports, along with detailed project reports, project dashboards, billing reports, project budgets and forecasts and other management and control tools.
Where Does the Data for Analysis Originate From? The Actual (historical transactions) data typically comes from enterprise resource planning (ERP) systems like: Microsoft Dynamics 365 (D365) Finance, Microsoft Dynamics 365 Business Central (D365 BC), Microsoft Dynamics AX, Microsoft Dynamics NAV, Microsoft Dynamics GP, Microsoft Dynamics SL, Sage Intacct, Sage 100, Sage 300, Sage 500, Sage X3, SAP Business One, SAP ByDesign, Acumatica, Netsuite and others. In analyses where budgets or forecasts are used, the planning data most often originates from in-house Excel spreadsheet models or from professional xFP&A solutions.
Built for technology finance teams and aligned with Solver's xFP&A platform, this Solver report template connects directly to your ERP data via the Solver Data Warehouse, enabling near real-time analysis with minimal setup. Designed for QuickStart deployment, it can be activated rapidly so your team can focus on analysis and decisions — not data preparation.
What is the Tech – Project Performance in Solver? The Tech – Project Performance is a pre-built xFP&A report template in Solver designed for technology organizations. It delivers key financial and operational metrics in a single, easy-to-use interface — purpose-built for technology finance workflows.
Who uses this Solver report template? This template is primarily used by CFOs, FP&A managers, and technology finance teams in technology organizations who need accurate, timely data to support planning, reporting, and decision-making. It is particularly valuable for technology finance teams managing budgets, forecasts, and performance reviews.
Where does the data come from? Data is sourced automatically from your ERP system through the Solver Data Warehouse, which integrates with platforms such as Microsoft Dynamics 365 Business Central, Dynamics 365 Finance, Acumatica, Sage Intacct, and other leading ERP solutions. Salesforce and subscription billing systems such as Binary Stream can also be connected for unified SaaS and technology metrics. Once connected, the template updates in near real-time with no manual data entry required.
To learn more, visit the Resource Library.