
Strategic KPIs vs Goal and Budget
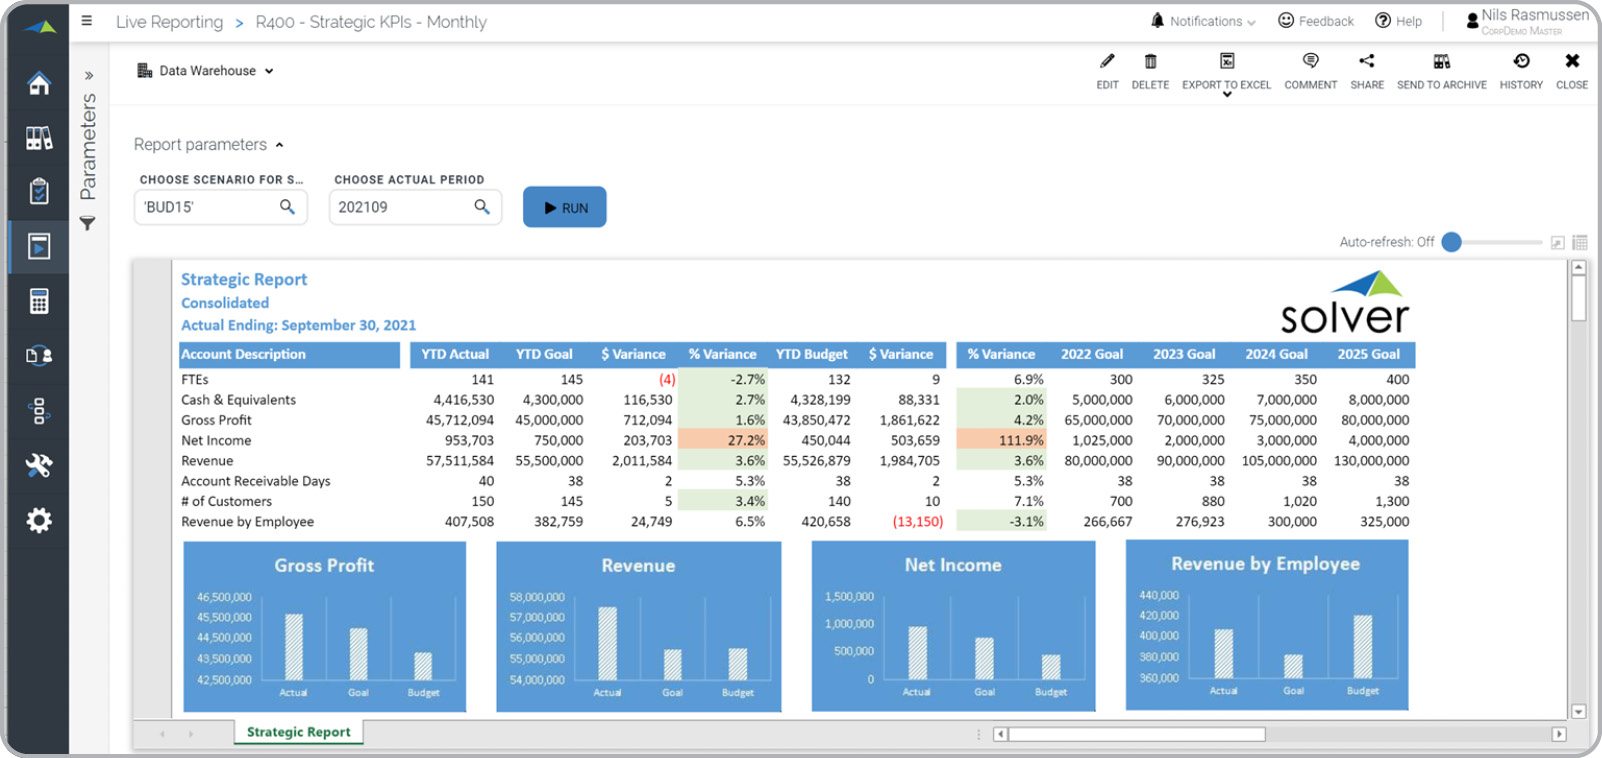
What is a Strategic KPI Report? Strategic KPI reports are considered executive dashboards and are often used by leadership teams to quickly determine how the organization is performing in key areas. Key functionality in this type of dashboard report provides the metrics in a professional and easy-to-read layout. It also displays top KPIs graphically in the charts at the bottom. Exceptions that breach target thresholds are highlighted with a red or green background. The far right columns display KPI targets for the coming four years. You will find an example of this type of dashboard report below.
Purpose of Strategic KPI Reports Companies and organizations use Strategic KPI Reports to make it easy for their management teams to monitor the company's most important performance indicators. When used as part of good business practices in a Financial Planning & Analysis (FP&A) Department, a company can improve its control and ensure that leadership teams prioritize the things that matter the most, as well as, reduce the chances that poor performance in strategic areas do not receive timely attention.
Who Uses This Type of Dashboard report? The typical users of this type of dashboard report are: Boards and Executives. Other Dashboard report s Often Used in Conjunction with Strategic KPI Reports Progressive Financial Planning & Analysis (FP&A) Departments sometimes use several different Strategic KPI Reports, along with financial reports, operational reports, dashboards and other management and control tools.
Where Does the Data for Analysis Originate From? The Actual (historical transactions) data typically comes from enterprise resource planning (ERP) systems like: Microsoft Dynamics 365 (D365) Finance, Microsoft Dynamics 365 Business Central (D365 BC), Microsoft Dynamics AX, Microsoft Dynamics NAV, Microsoft Dynamics GP, Microsoft Dynamics SL, Sage Intacct, Sage 100, Sage 300, Sage 500, Sage X3, SAP Business One, SAP ByDesign, Acumatica, Netsuite and others. In analyses where budgets or forecasts are used, the planning data most often originates from in-house Excel spreadsheet models or from professional xFP&A solutions.
This Solver planning template connects directly to your ERP data via the Solver Data Warehouse, enabling near real-time analysis with minimal setup. Designed for QuickStart deployment, it can be activated rapidly so your team can focus on analysis and decisions — not data preparation.
What is the Strategic KPIs vs Goal and Budget in Solver? The Strategic KPIs vs Goal and Budget is a pre-built xFP&A planning template in Solver that allows finance and business teams to submit planning data directly in Solver, with automatic roll-up to consolidated budget and forecast models.
Who uses this Solver planning template? This template is primarily used by CFOs, FP&A managers, and budget owners who need a structured, controlled way to collect and submit planning data in Solver. Department managers and budget owners use it to submit their numbers directly, eliminating manual spreadsheet consolidation.
Where does the data come from? Data is sourced automatically from your ERP system through the Solver Data Warehouse, which integrates with platforms such as Microsoft Dynamics 365 Business Central, Dynamics 365 Finance, Acumatica, Sage Intacct, and other leading ERP solutions. Once connected, the template updates in near real-time with no manual data entry required.
To learn more, visit the Resource Library.