
Sports – Stadium Metrics
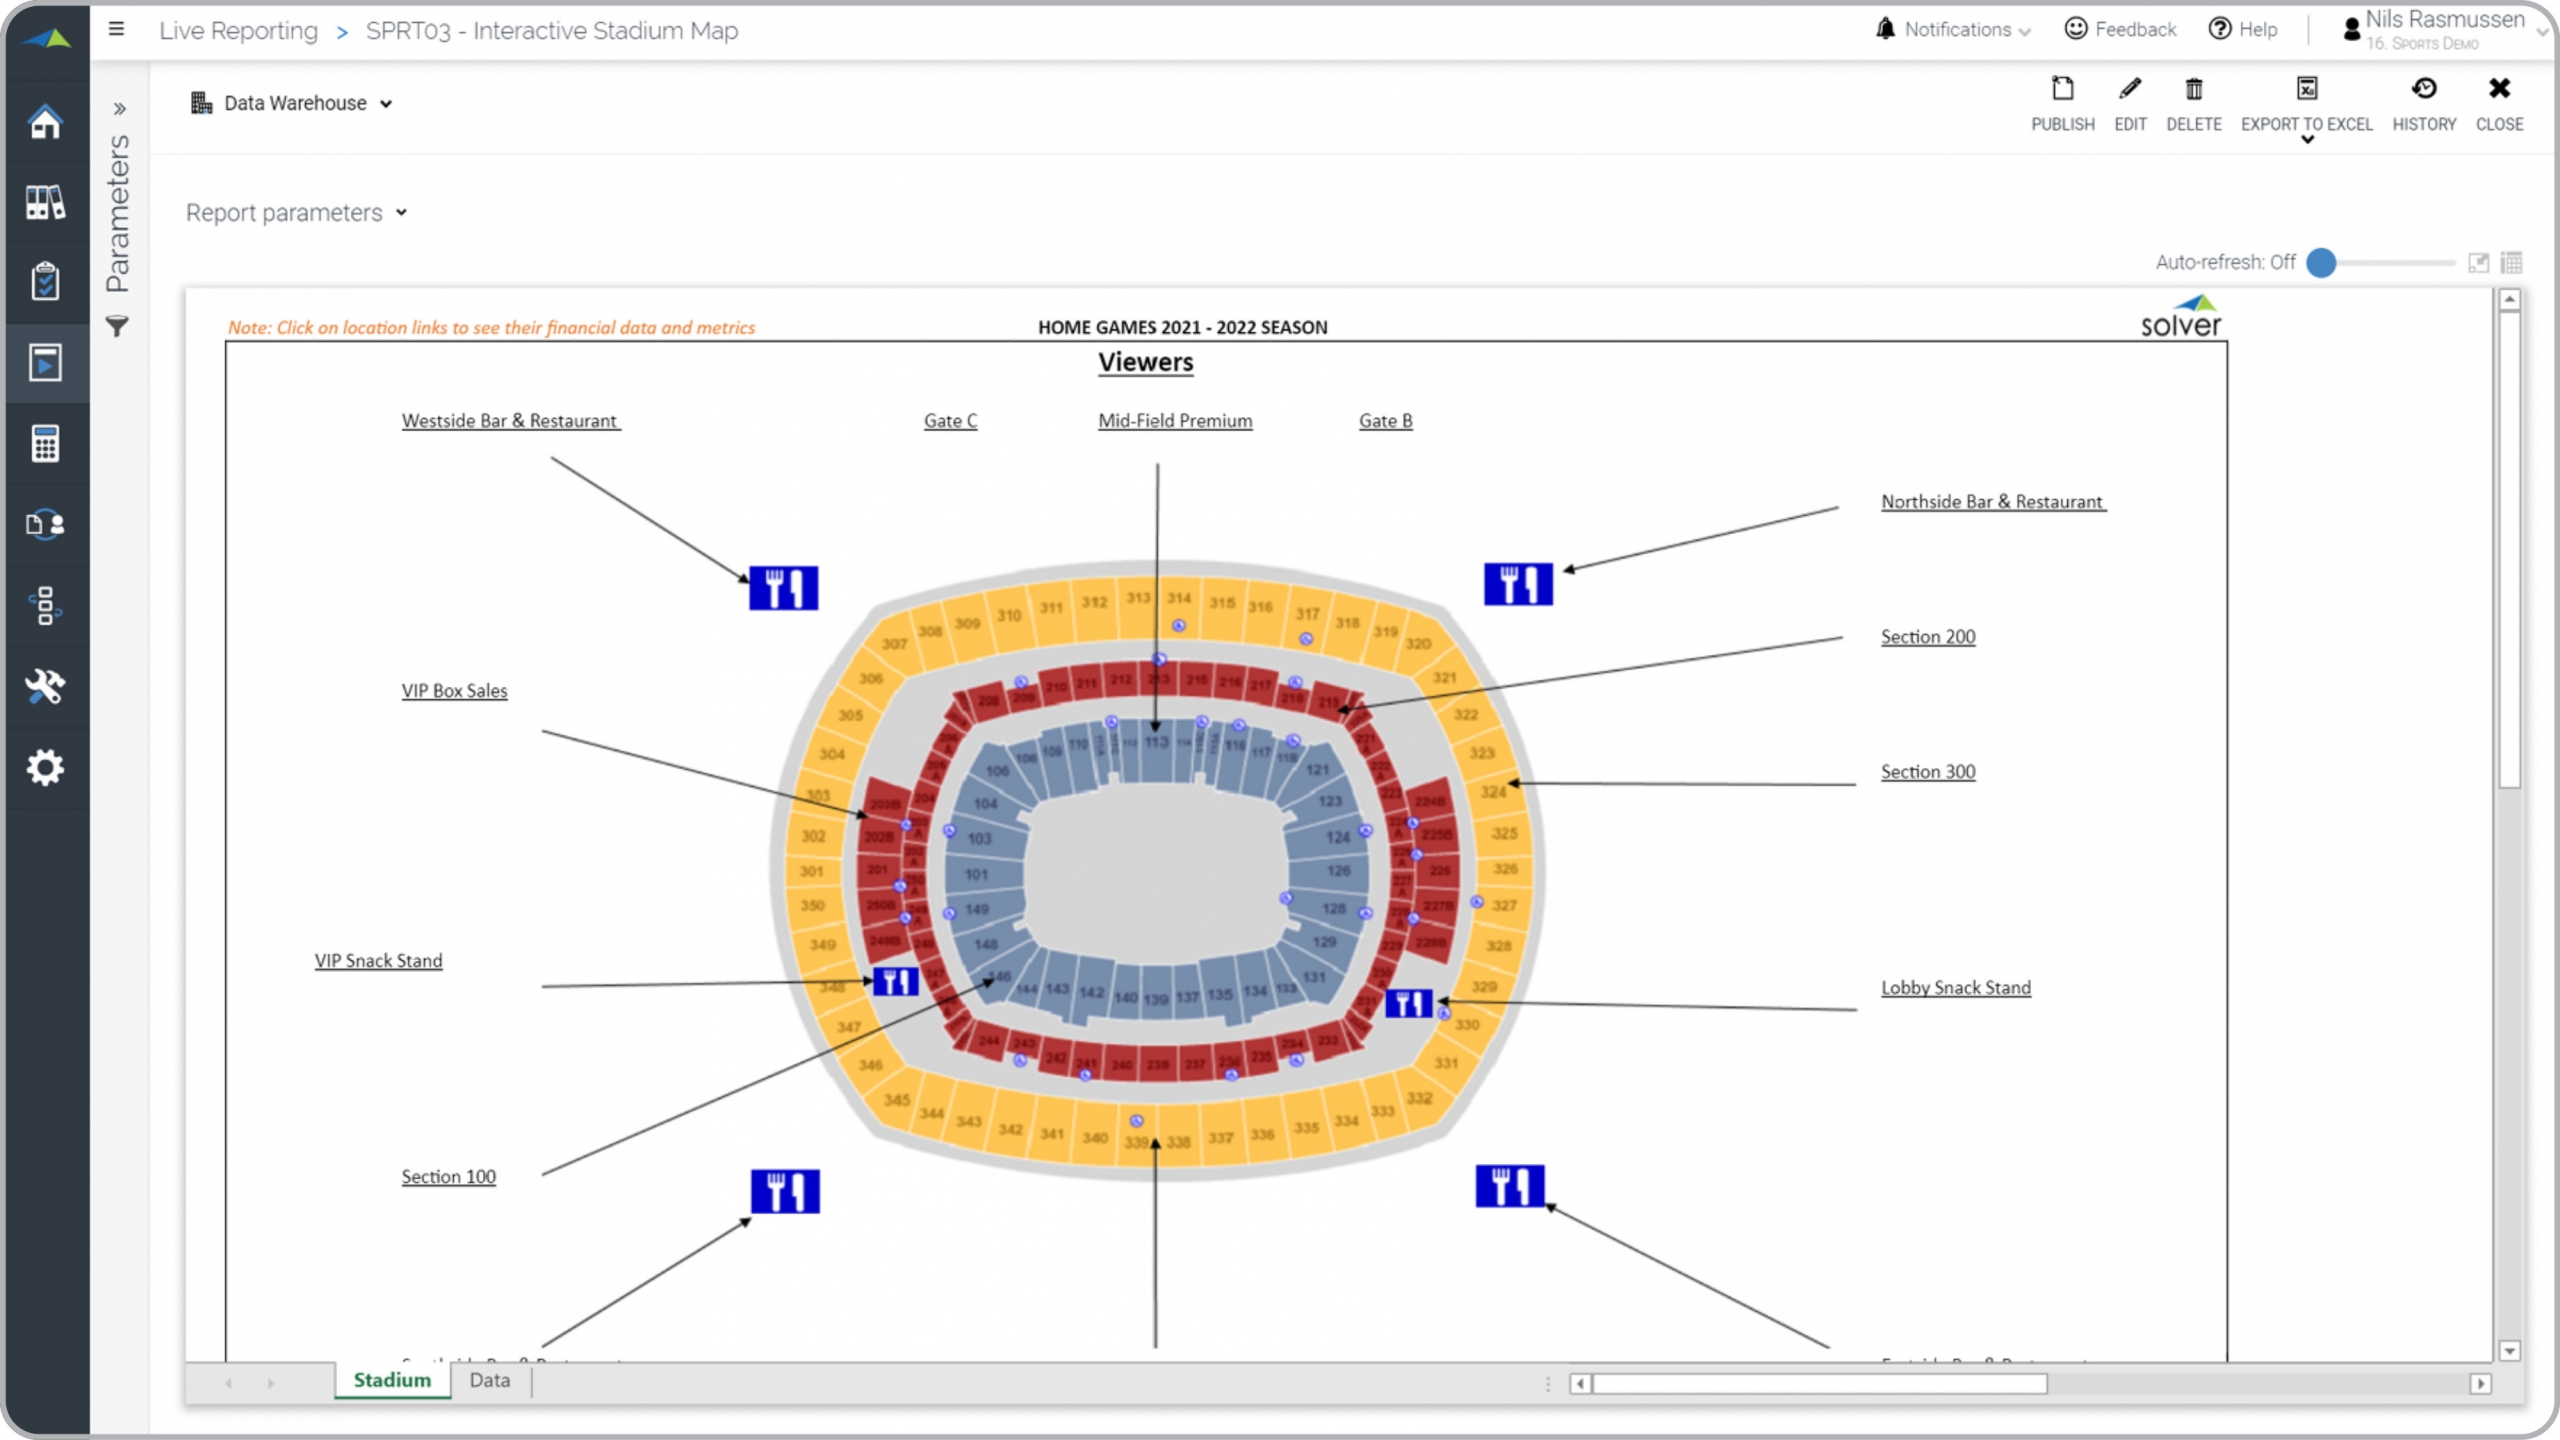
What is a Stadium Revenue Report? Stadium Revenue Reports are considered sales analysis tools and are used by venue and retail managers to analyze revenues from tickets, food and retail outlets in a sports venue. Some of the main functionality in this type of report is that it displays an easy to understand map of the stadium with hyperlinks to each revenue-generating location. The hyperlinks goes to a second page (not visible in the image below) which contains data like: Ticket sales by seat location, Food & beverage sales by restaurant/outlet (with detailed sales by F&B category), and # of individuals entering each gate. You find an example of this type of report below.
Purpose of Stadium Revenue Reports Venue Owners use Stadium Revenue Reports to give managers an easy way to analyze the different revenue sources located in the venue. When used as part of good business practices by venue managers and FP&A departments, a stadium owner can improve its revenues and optimize decisions related to venue restaurants and retail locations, and it can reduce the chances that sales are sub-optimized due to lack of insight to location and vendor/outlet performance.
Who Uses This Type of Report? The typical users of this type of report are: Venue managers, retail managers, CFOs. Other Reports Often Used in Conjunction with Stadium Revenue Reports Progressive venue managers and FP&A departments sometimes use several different Stadium Revenue Reports, along with profit & loss reports, sales dashboards, KPI reports, annual budgets and forecasts and other management and control tools.
Where Does the Data for Analysis Originate From? The Actual (historical transactions) data typically comes from enterprise resource planning (ERP) systems like: Microsoft Dynamics 365 (D365) Finance, Microsoft Dynamics 365 Business Central (D365 BC), Microsoft Dynamics AX, Microsoft Dynamics NAV, Microsoft Dynamics GP, Microsoft Dynamics SL, Sage Intacct, Sage 100, Sage 300, Sage 500, Sage X3, SAP Business One, SAP ByDesign, Acumatica, Netsuite and others. In analyses where budgets or forecasts are used, the planning data most often originates from in-house Excel spreadsheet models or from professional xFP&A solutions.
Built for sports finance teams and aligned with Solver's xFP&A platform, this Solver report template connects directly to your ERP data via the Solver Data Warehouse, enabling near real-time analysis with minimal setup. Designed for QuickStart deployment, it can be activated rapidly so your team can focus on analysis and decisions — not data preparation.
What is the Sports – Stadium Metrics in Solver? The Sports – Stadium Metrics is a pre-built xFP&A report template in Solver designed for sports organizations. It delivers key financial and operational metrics in a single, easy-to-use interface — purpose-built for sports finance workflows.
Who uses this Solver report template? Finance leaders at sports organizations — including CFOs, finance managers, and sports organization executives — use this template to get fast, reliable answers without waiting on IT or building custom reports. It supports both day-to-day monitoring and strategic decision-making.
Where does the data come from? Data is sourced automatically from your ERP system through the Solver Data Warehouse, which integrates with platforms such as Microsoft Dynamics 365 Business Central, Dynamics 365 Finance, Acumatica, Sage Intacct, and other leading ERP solutions. Point-of-sale, ticketing, and broadcasting revenue systems can also be connected for a complete event and venue revenue picture. Once connected, the template updates in near real-time with no manual data entry required.
To learn more, visit the Resource Library.