
Sales Simulation
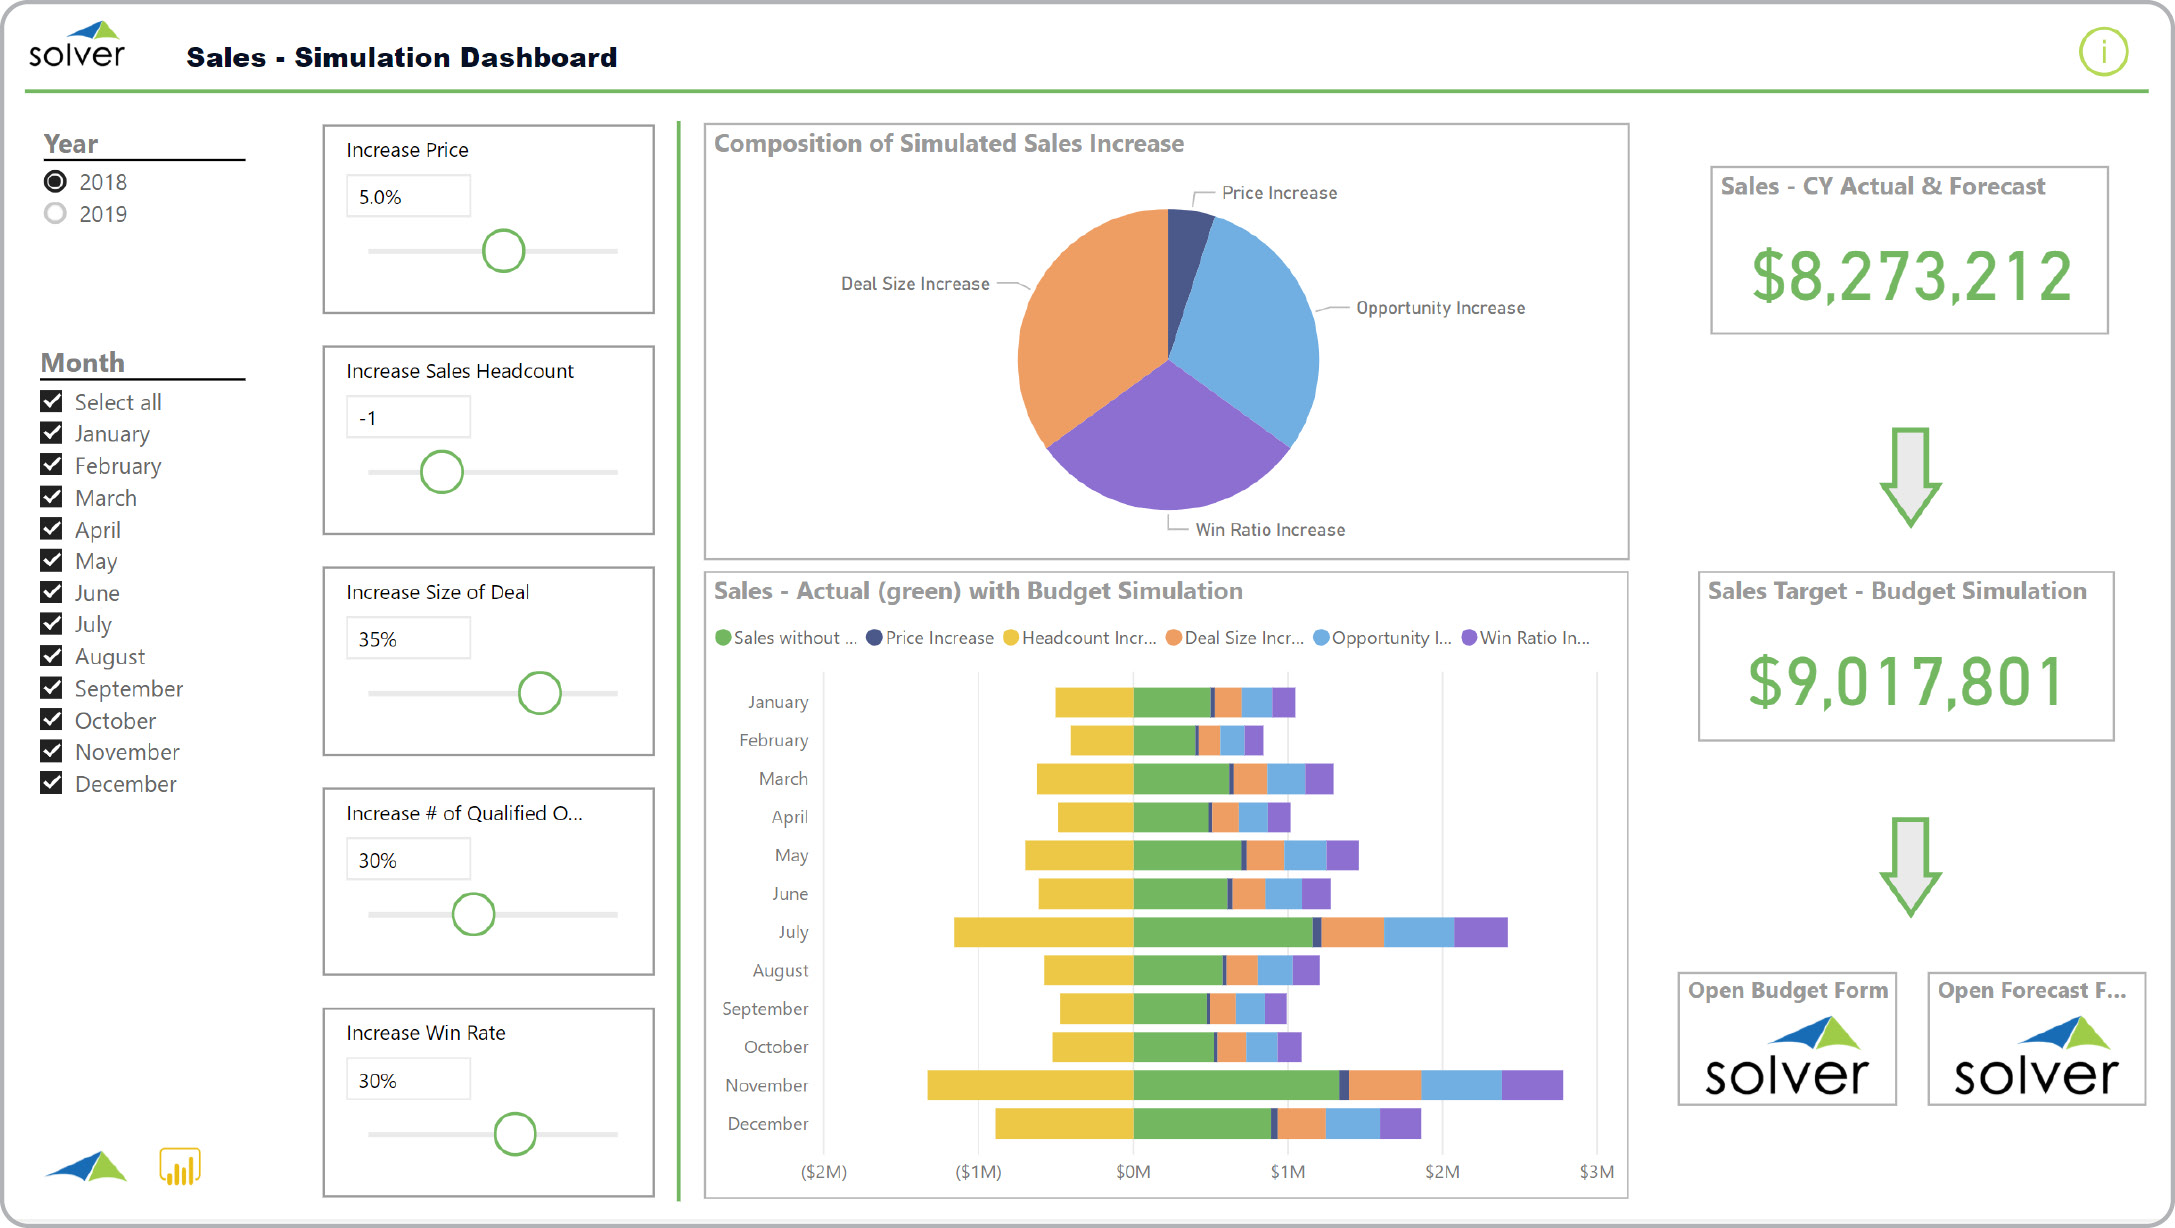
What is a Sales Budget Simulation Dashboard? Sales Budget Simulation Dashboards are considered planning tools and are used by sales executives to model what the sales budget target should be before and after final approval. Some of the main functionality in this type of simulation dashboard is that it automatically combines actual year-to-date sales with forecast and provides interactive sliders where the user can simulate changes to various sales drivers. These drivers are seen on the left side of the dashboard and include: 1) Price increase, 2) Increase in sales headcount, 3) Increase in (average) deal size, 4) Increase in number of qualified opportunities, and 5) Increase in win ratio. Once the sliders have been adjusted by dragging them left or right, the dashboard displays the new sales target to be used in the budget process, and the user clicks the "Open Budget form" button to open the detailed input form for the sales budget. You find an example of this type of simulation dashboard below.
Purpose of Sales Budget Simulation Dashboards Companies use Sales Budget Simulation Dashboards to enable sales executives to quickly and easily model the total annual sales budget prior to the budget input process. When used as part of good business practices in a Financial Planning & Analysis (FP&A) and Sales department, an organization can improve its sales budget accuracy, and it can reduce the chances that a pure bottom-up sales process misses realistic targets because of lack of sales modelling in the beginning of the planning process.
Who Uses This Type of Simulation dashboard? The typical users of this type of simulation dashboard are: Sales executives. Other Dashboard s and Reports Often Used in Conjunction with Sales Budget Simulation Dashboards Progressive Financial Planning & Analysis (FP&A) and Sales departments sometimes use several different Sales Budget Simulation Dashboards, along with sales budget input models, sales dashboards, sales reports, CRM pipeline reports, budget summary dashboards, financial statements with trended budget figures and other management and control tools.
Where Does the Data for Analysis Originate From? The Actual (historical transactions) data typically comes from enterprise resource planning (ERP) systems like: Microsoft Dynamics 365 (D365) Finance, Microsoft Dynamics 365 Business Central (D365 BC), Microsoft Dynamics AX, Microsoft Dynamics NAV, Microsoft Dynamics GP, Microsoft Dynamics SL, Sage Intacct, Sage 100, Sage 300, Sage 500, Sage X3, SAP Business One, SAP ByDesign, Acumatica, Netsuite and others. In analyses where budgets or forecasts are used, the planning data most often originates from in-house Excel spreadsheet models or from professional xFP&A solutions.
This Solver report template connects directly to your ERP data via the Solver Data Warehouse, enabling near real-time analysis with minimal setup. Designed for QuickStart deployment, it can be activated rapidly so your team can focus on analysis and decisions — not data preparation.
What is the Sales Simulation in Solver? The Sales Simulation is a pre-built xFP&A report template in Solver that delivers key financial and operational metrics in a single, easy-to-use interface, eliminating the need for manual data work or custom report development.
Who uses this Solver report template? Cfos, fp&a managers, and controllers rely on this Solver report template for consistent, parameter-driven reporting that can be run on demand or on a scheduled basis. It eliminates the manual work typically required to produce this type of analysis.
Where does the data come from? Data is sourced automatically from your ERP system through the Solver Data Warehouse, which integrates with platforms such as Microsoft Dynamics 365 Business Central, Dynamics 365 Finance, Acumatica, Sage Intacct, and other leading ERP solutions. Once connected, the template updates in near real-time with no manual data entry required.
To learn more, visit the Resource Library.