
Sales Opportunity Analysis
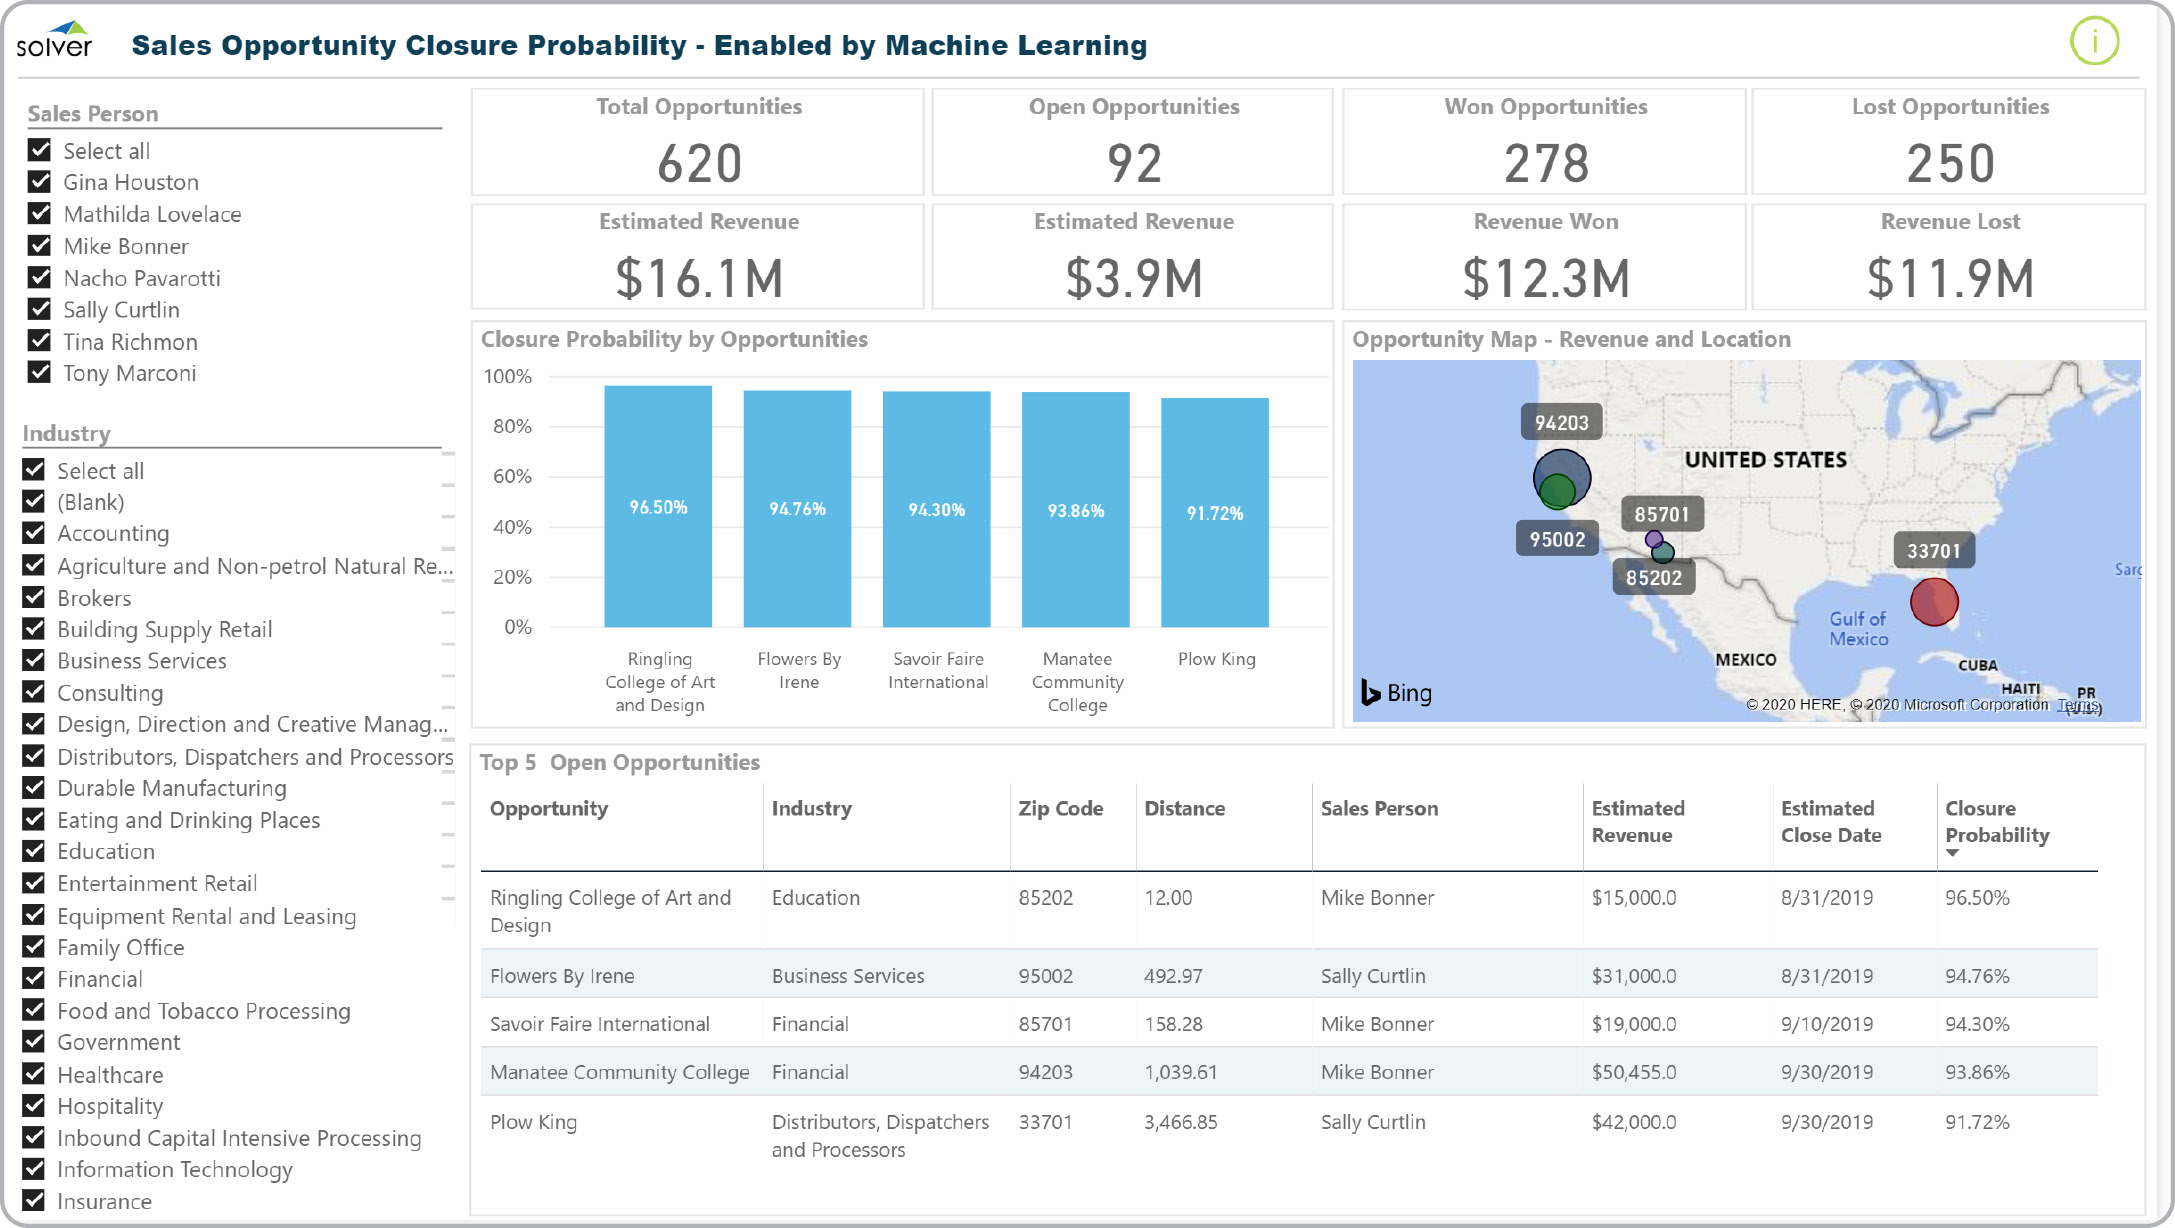
What is a Sales Opportunity Recommendation Dashboard? Opportunity Recommendation Dashboards are considered sales optimization tools and are used by sales managers and the sales team to get an automatically ranked list of opportunities to focus on before and after final approval. Some of the main functionality in this type of dashboard is that it looks at a number of factors and then uses algorithms to rank all opportunities that a sales person should focus on first. These factors include: 1) Customer distance from sales person, 2) Sales person track record, 3) Estimated revenue, 4) Estimated close date, and 5) Entered probability. The dashboard than comes up with a weighted probability for each opportunity and uses this metric to rank the list of potential deals. The charts and KPIs are supplementary information to show sales executives a bigger picture of the pipeline. The filters on the left of the dashboard enable the user to select specific sales people and specific industries. You find an example of this type of dashboard below.
Purpose of Sales Opportunity Recommendation Dashboards Companies use Sales Opportunity Recommendation Dashboards to automatically recommend which opportunities a sales person should work on first. When used as part of good business practices in a Sales department, an organization can improve its win ratio and increase revenues, and it can reduce the chances of sales people and their managers accidentally prioritize less attractive opportunities.
Who Uses This Type of Dashboard? The typical users of this type of dashboard are: Chief Revenue Officers, VP of Sales, Sales Managers, Sales Managers, Sales Team Members. Other Dashboards and Reports Often Used in Conjunction with Sales Opportunity Recommendation Dashboards Progressive Sales departments sometimes use several different Sales Opportunity Recommendation Dashboards, along with CRM reports, opportunity reports, pipeline reports, pipeline dashboards, sales dashboards, sales performance reports, win/loss reports and other management and control tools.
Where Does the Data for Analysis Originate From? The Actual (historical transactions) data typically comes from enterprise resource planning (ERP) systems like: Microsoft Dynamics 365 (D365) Finance, Microsoft Dynamics 365 Business Central (D365 BC), Microsoft Dynamics AX, Microsoft Dynamics NAV, Microsoft Dynamics GP, Microsoft Dynamics SL, Sage Intacct, Sage 100, Sage 300, Sage 500, Sage X3, SAP Business One, SAP ByDesign, Acumatica, Netsuite and others. In analyses where budgets or forecasts are used, the planning data most often originates from in-house Excel spreadsheet models or from xFP&A solutions. Lead, campaign and pipeline data usually originates from a CRM system like Salesforce or Microsoft Dynamics 365 Customer Experience (D365 CE).
This Solver report template connects directly to your ERP data via the Solver Data Warehouse, enabling near real-time analysis with minimal setup. Designed for QuickStart deployment, it can be activated rapidly so your team can focus on analysis and decisions — not data preparation.
What is the Sales Opportunity Analysis in Solver? The Sales Opportunity Analysis is a pre-built xFP&A report template in Solver that delivers key financial and operational metrics in a single, easy-to-use interface, eliminating the need for manual data work or custom report development.
Who uses this Solver report template? Cfos, fp&a managers, and controllers rely on this Solver report template for consistent, parameter-driven reporting that can be run on demand or on a scheduled basis. It eliminates the manual work typically required to produce this type of analysis.
Where does the data come from? Data is sourced automatically from your ERP system through the Solver Data Warehouse, which integrates with platforms such as Microsoft Dynamics 365 Business Central, Dynamics 365 Finance, Acumatica, Sage Intacct, and other leading ERP solutions. Once connected, the template updates in near real-time with no manual data entry required.
To learn more, visit the Resource Library.