
Real Estate – Sales by State
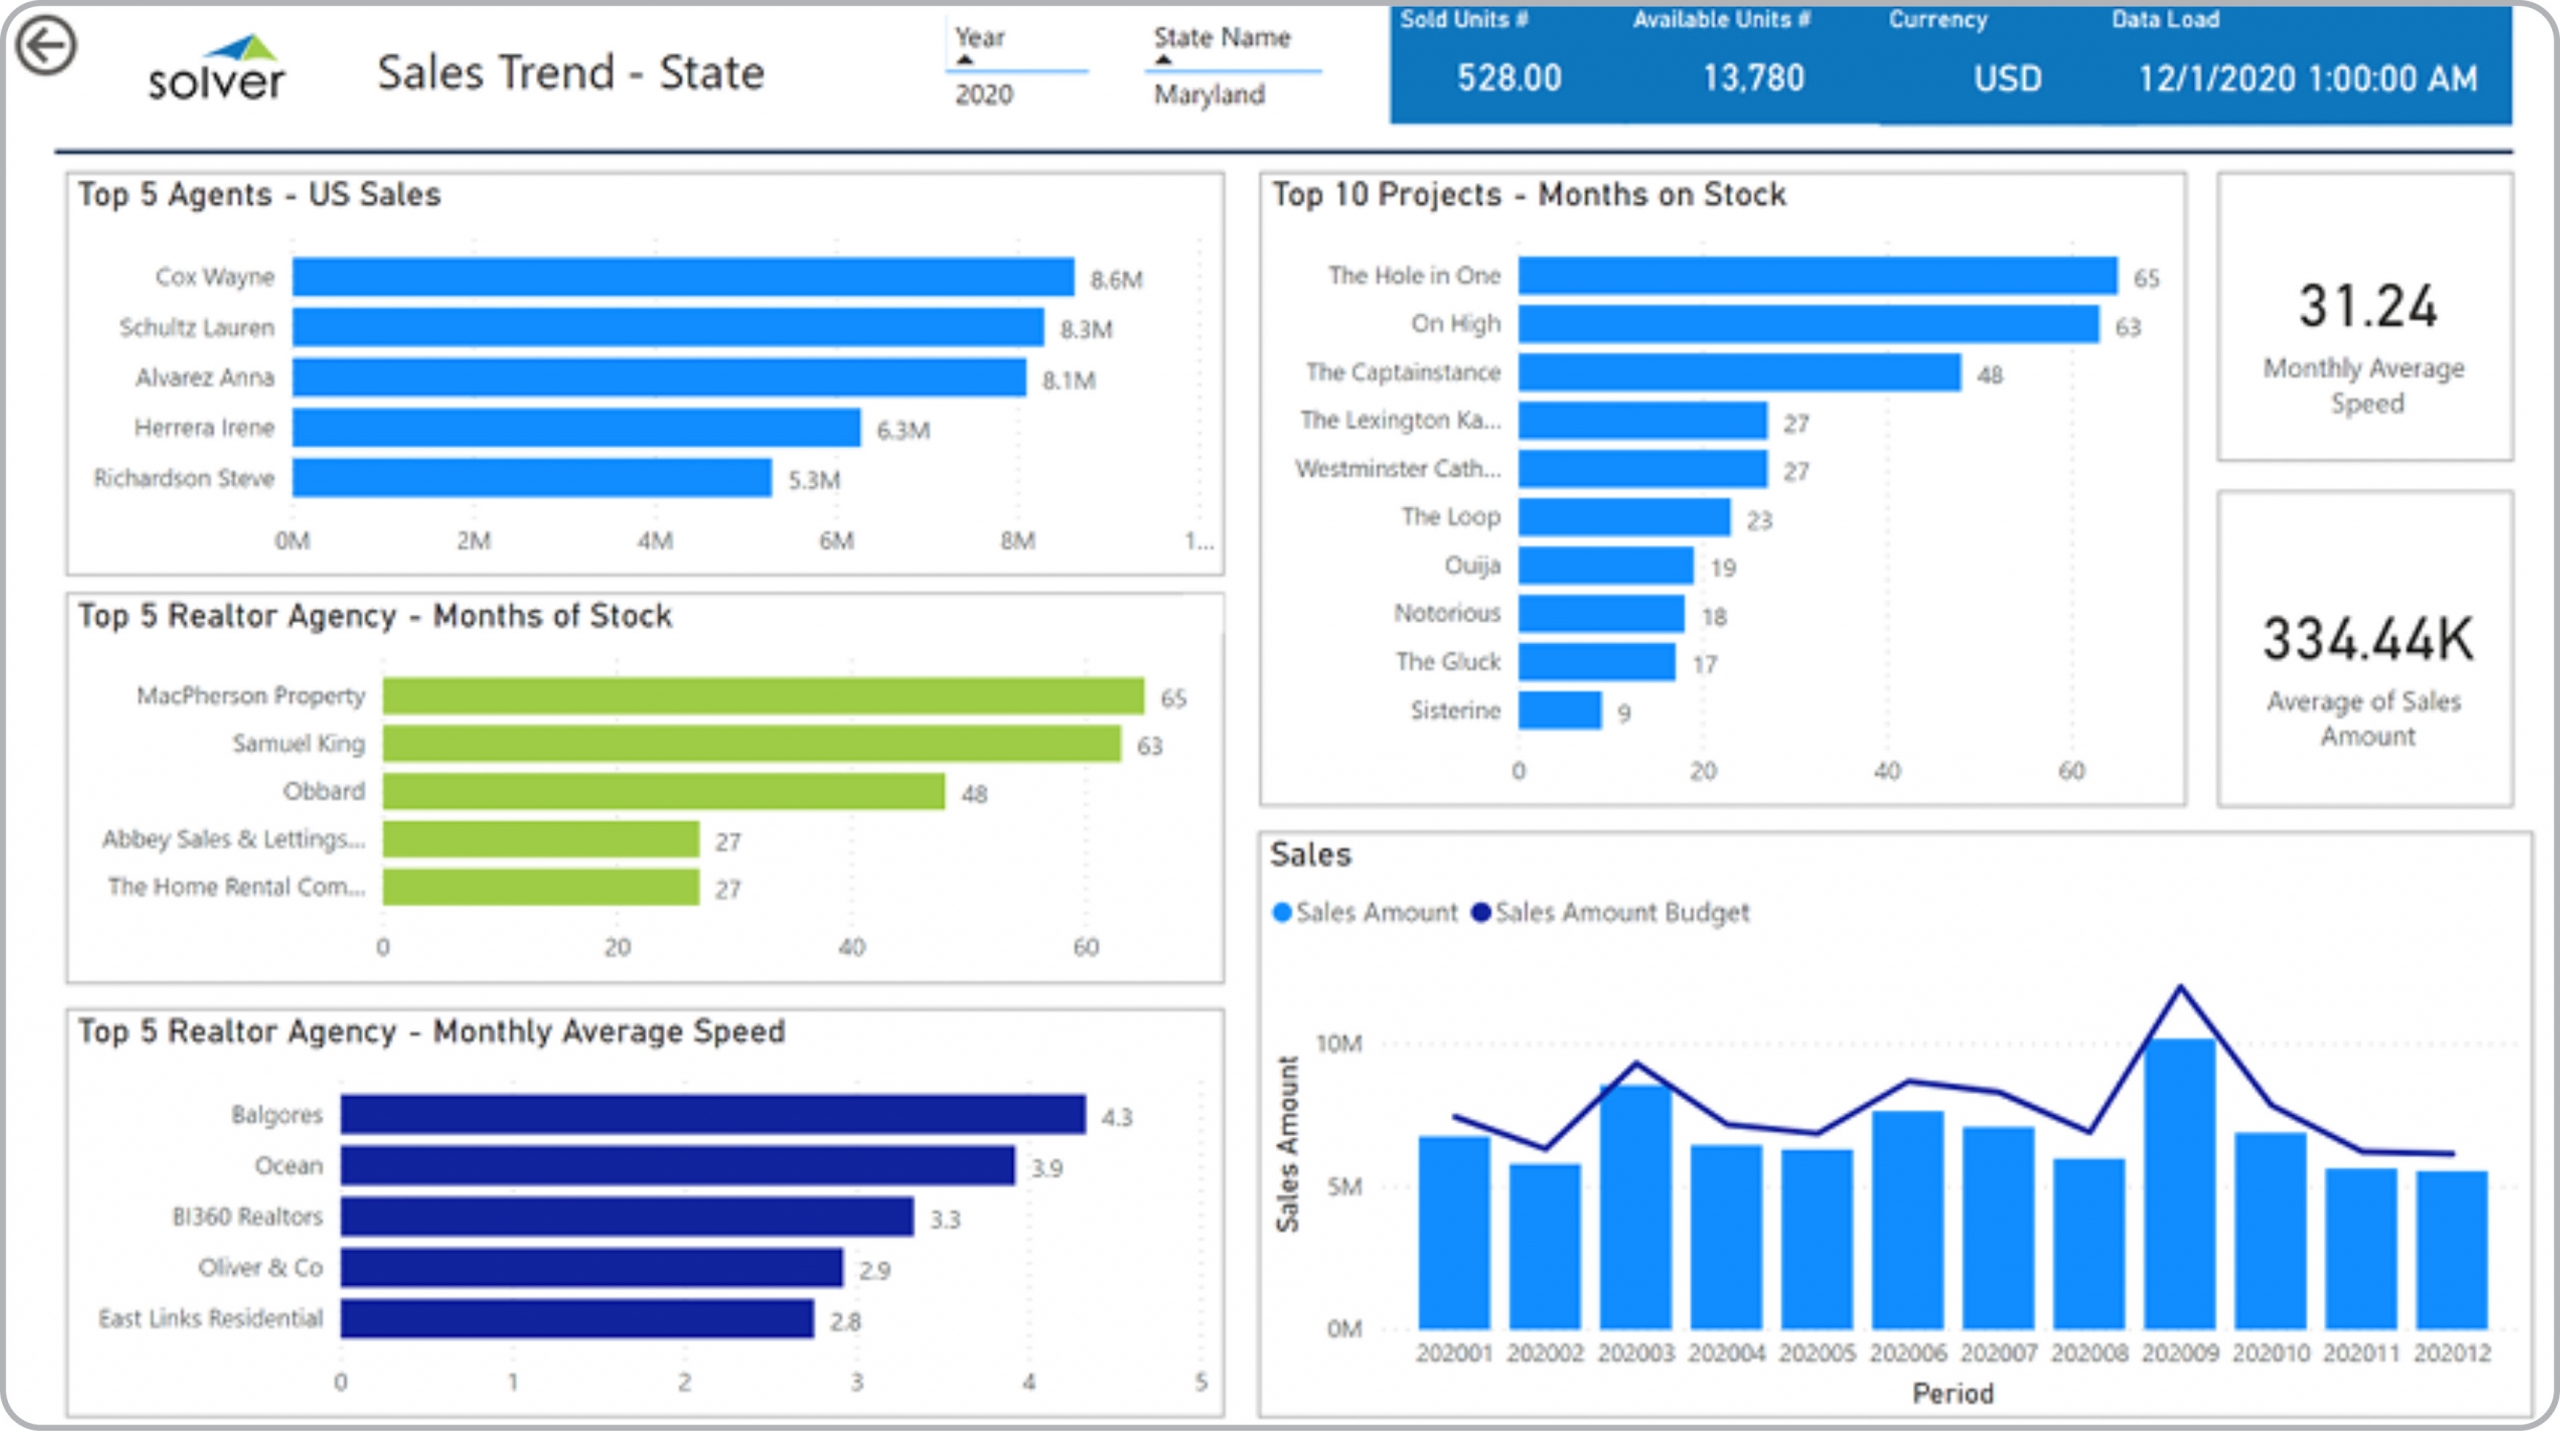
What is a Sales by State Dashboard? Sales by region dashboards are considered territory analysis tools and are used by executives and sales leaders to analyze regional performance metrics. Some of the main functionality in this type of dashboard is that it enables easy sales monitoring with five charts as well as two KPI sections. The user selects the period and state (territory) in the boxes seen on top of the dashboard and this will then filter all the data in the dashboard. The visuals include: 1) Top 5 agents by sales, 2) Top 5 realtor agencies by months of stock, 3) Top 5 realtor agencies by monthly average speed, 4) Top 10 real estate projects by months of available stock, 5) Actual versus budget monthly sales trend, and 6) KPIs for total sold units, total available units, total monthly average speed, and total average sales amount. You find an example of this type of dashboard below.
Purpose of Real Estate Sales by State Dashboards Real Estate organizations use Sales by State Dashboards to provide corporate managers with interactive analysis of regional sales performance. When used as part of good business practices in Financial Planning & Analysis (FP&A) and sales departments, an organization can improve and speed up its regional strategies and grow revenues, and it can reduce the chances that managers don't quickly catch anomalies in certain territories.
Who Uses This Type of Dashboard? The typical users of this type of dashboard are: Executives, CFOs, analysts, regional managers. Other Reports Often Used in Conjunction with Sales by State Dashboards Progressive Financial Planning & Analysis (FP&A) departments sometimes use several different Sales by State Dashboards, along with financial dashboards, consolidated and local office profit & loss reports, sales reports, sales forecast, annual budgets, project reports and other management and control tools.
Where Does the Data for Analysis Originate From? The Actual (historical transactions) data typically comes from enterprise resource planning (ERP) systems like: Microsoft Dynamics 365 (D365) Finance, Microsoft Dynamics 365 Business Central (D365 BC), Microsoft Dynamics AX, Microsoft Dynamics NAV, Microsoft Dynamics GP, Microsoft Dynamics SL, Sage Intacct, Sage 100, Sage 300, Sage 500, Sage X3, SAP Business One, SAP ByDesign, Acumatica, Netsuite and others. In analyses where budgets or forecasts are used, the planning data most often originates from in-house Excel spreadsheet models or from professional xFP&A solutions.
Built for real estate finance teams and aligned with Solver's xFP&A platform, this Solver report template connects directly to your ERP data via the Solver Data Warehouse, enabling near real-time analysis with minimal setup. Designed for QuickStart deployment, it can be activated rapidly so your team can focus on analysis and decisions — not data preparation.
What is the Real Estate – Sales by State in Solver? The Real Estate – Sales by State is a pre-built xFP&A report template in Solver designed for real estate organizations. It delivers key financial and operational metrics in a single, easy-to-use interface — purpose-built for real estate finance workflows.
Who uses this Solver report template? Cfos, asset managers, and real estate finance teams in real estate organizations rely on this Solver report template to replace manual spreadsheet-based processes with automated, near real-time analysis. It is especially useful during month-end close, budget cycles, and board reporting.
Where does the data come from? Data is sourced automatically from your ERP system through the Solver Data Warehouse, which integrates with platforms such as Microsoft Dynamics 365 Business Central, Dynamics 365 Finance, Acumatica, Sage Intacct, and other leading ERP solutions. CRM and property management systems can also be connected to enrich sales pipeline and portfolio performance data. Once connected, the template updates in near real-time with no manual data entry required.
To learn more, visit the Resource Library.