
P&L – With links to AR & AP Reports
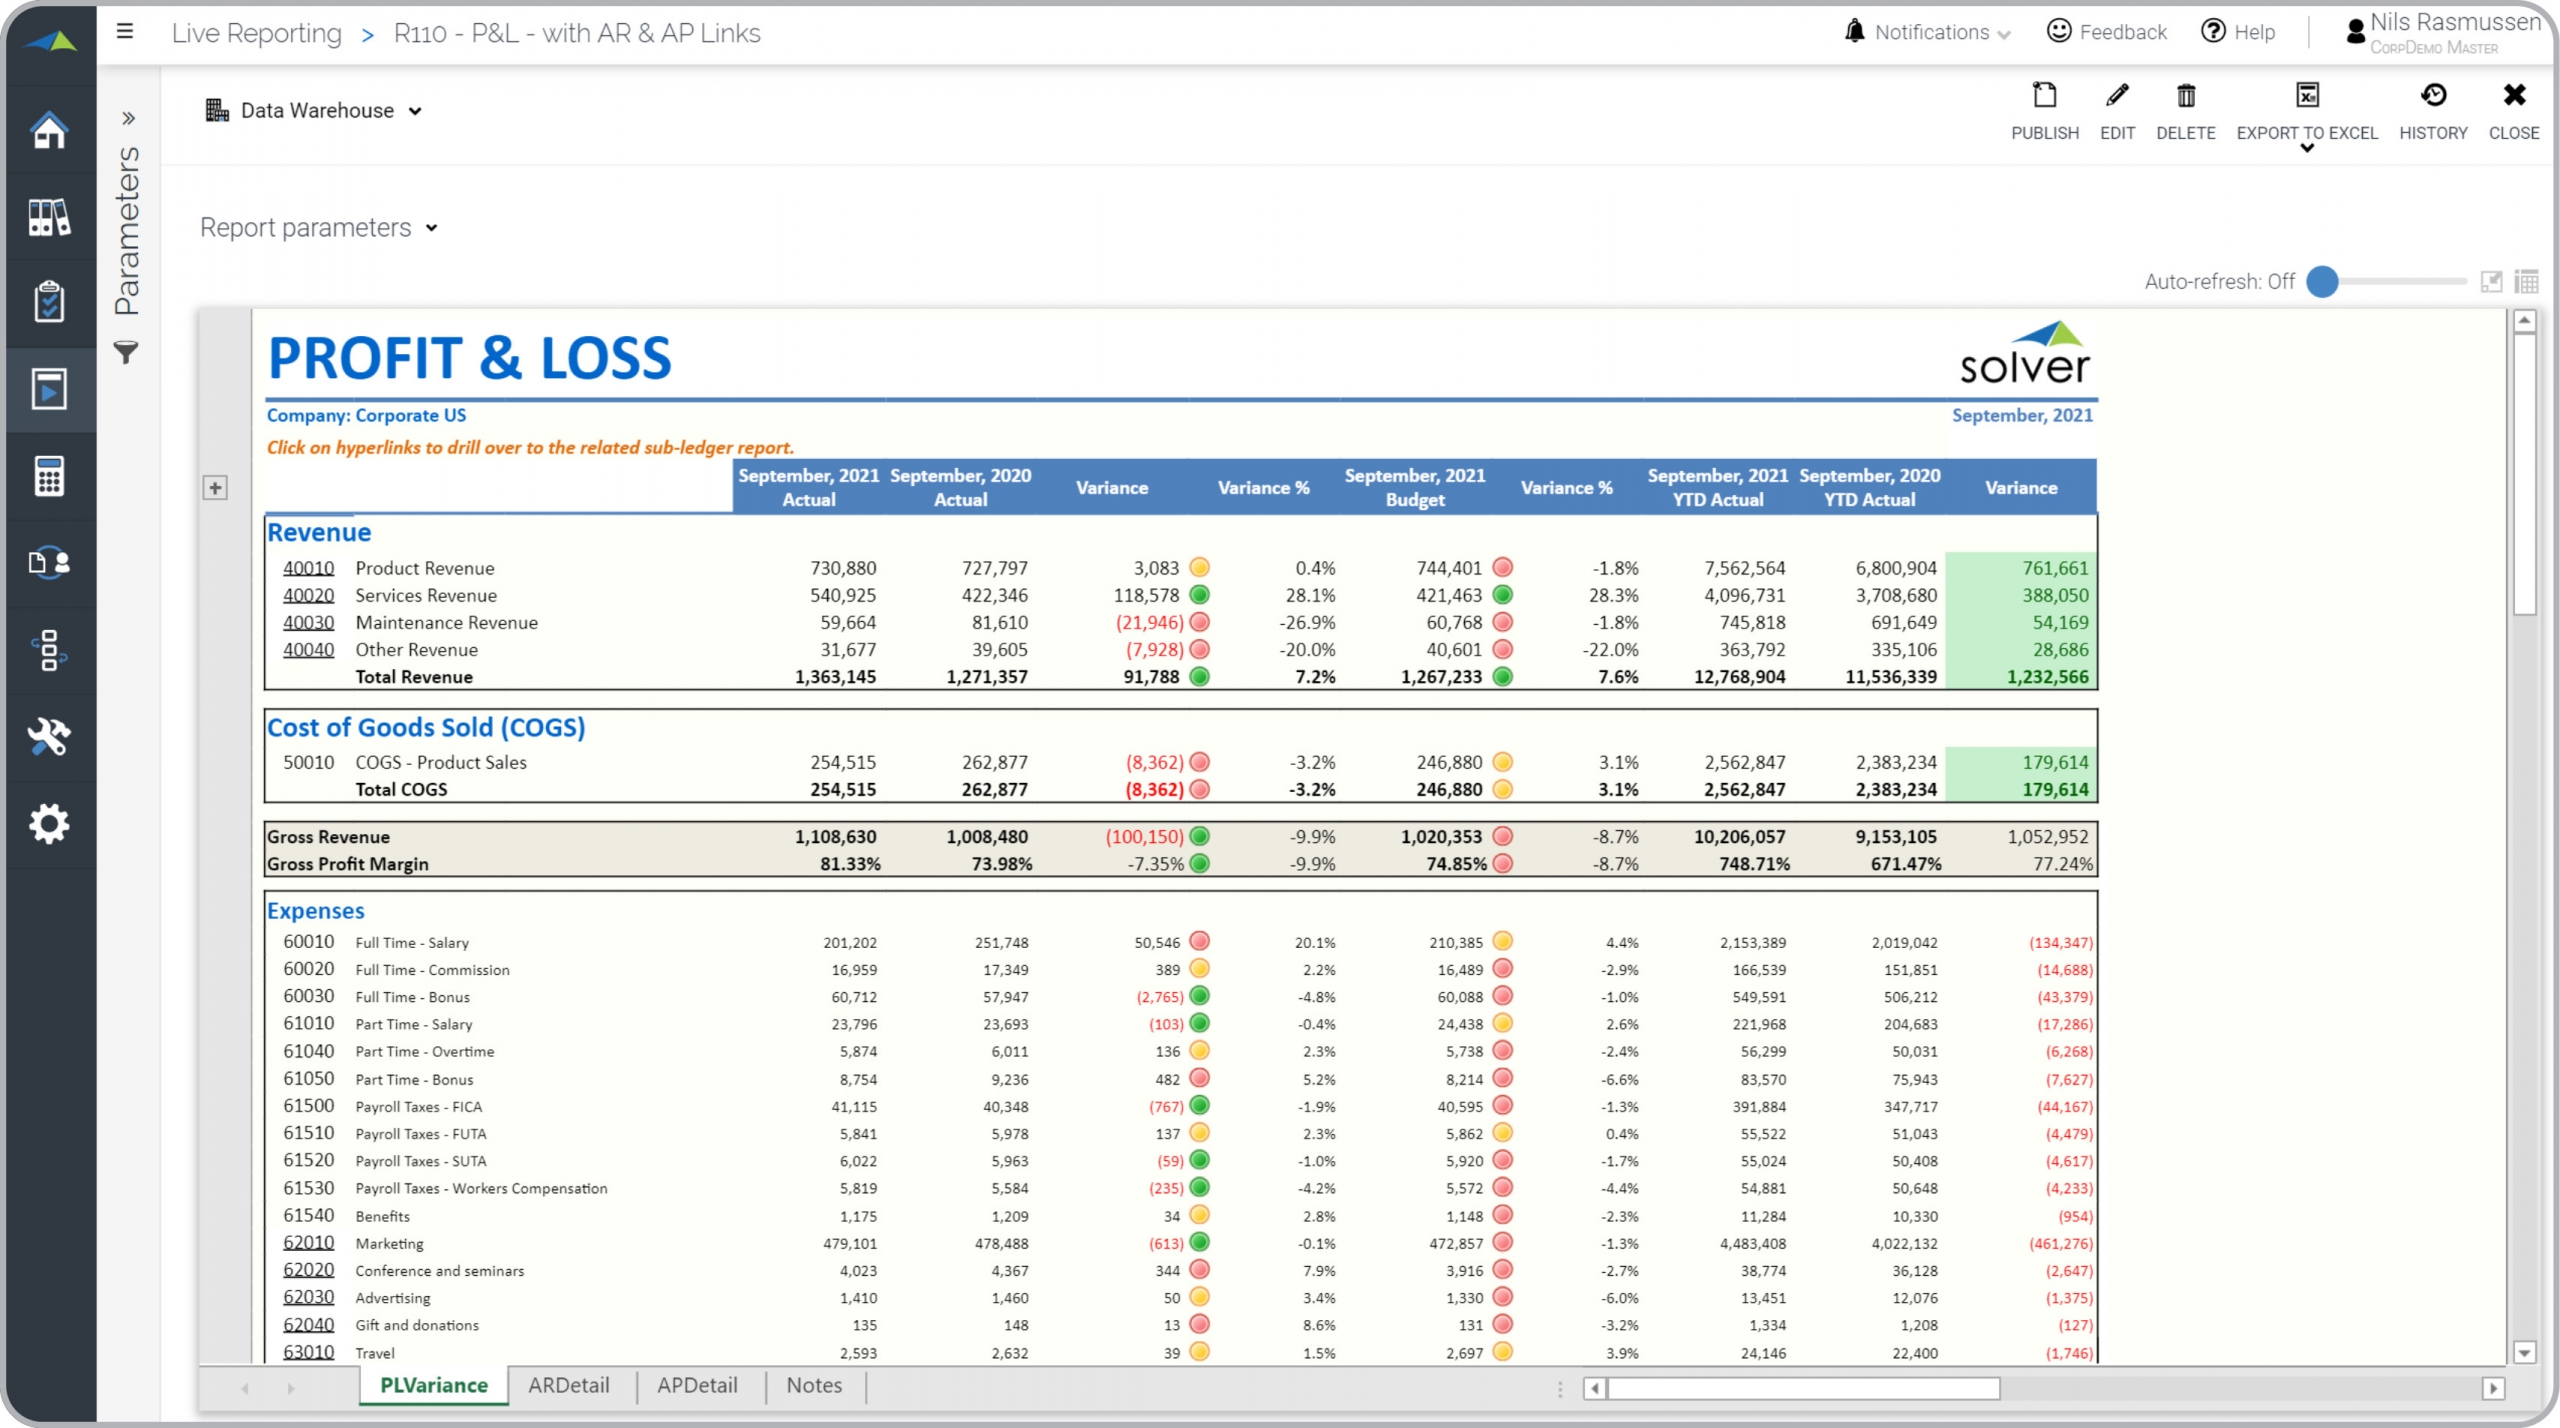
What is a Profit & Loss Report with Links to Supporting Sub-ledger Reports? Financial statements with links to sub-ledger reports are considered self-service analysis reports and are often used by managers and accountants to provide users with easy answers to their questions. Key functionality in this type of report allows the user to click on the hyperlinked account numbers located in the first column. These links will open a different report that provides granular details about the figure seen in the financial statement. Examples of such reports can include a sales report explaining a revenue figure, or an accounts payable report explaining the details behind an expense figure. You will find an example of this type of report below.
Purpose of Profit & Loss Reports with Links to Supporting Sub-ledger Reports Companies and organizations use Profit & Loss Reports with Links to Supporting Sub-ledger Reports to give users a way to answer their questions by providing direct drill-down to detailed sub-ledger transactions. When used as part of good business practices in a Financial Planning & Analysis (FP&A) Department, a company can improve its speed of decision-making, as well as, reduce the time that managers constantly ask accountants to go back to the ERP system to explain figures in financial statements.
Who Uses This Type of Report? The typical users of this type of report are: Executives, Department Heads and Financial Managers. Other Reports Often Used in Conjunction with Profit & Loss Reports with Links to Supporting Sub-ledger Reports Progressive Financial Planning & Analysis (FP&A) Departments sometimes use several different Profit & Loss Reports with Links to Supporting Sub-ledger Reports, along with balance sheets, cash flow reports, transaction analysis reports and other management and control tools.
Where Does the Data for Analysis Originate From? The Actual (historical transactions) data typically comes from enterprise resource planning (ERP) systems like: Microsoft Dynamics 365 (D365) Finance, Microsoft Dynamics 365 Business Central (D365 BC), Microsoft Dynamics AX, Microsoft Dynamics NAV, Microsoft Dynamics GP, Microsoft Dynamics SL, Sage Intacct, Sage 100, Sage 300, Sage 500, Sage X3, SAP Business One, SAP ByDesign, Acumatica, Netsuite and others. In analyses where budgets or forecasts are used, the planning data most often originates from in-house Excel spreadsheet models or from professional xFP&A solutions.
This Solver report template connects directly to your ERP data via the Solver Data Warehouse, enabling near real-time analysis with minimal setup. Designed for QuickStart deployment, it can be activated rapidly so your team can focus on analysis and decisions — not data preparation.
What is the P&L – With links to AR & AP Reports in Solver? The P&L – With links to AR & AP Reports is a pre-built xFP&A report template in Solver that delivers key financial and operational metrics in a single, easy-to-use interface, eliminating the need for manual data work or custom report development.
Who uses this Solver report template? This template is primarily used by CFOs, FP&A managers, and controllers who need accurate, timely reporting without manual data preparation. It is also valuable for department heads and business unit leaders who need periodic performance summaries.
Where does the data come from? Data is sourced automatically from your ERP system through the Solver Data Warehouse, which integrates with platforms such as Microsoft Dynamics 365 Business Central, Dynamics 365 Finance, Acumatica, Sage Intacct, and other leading ERP solutions. Once connected, the template updates in near real-time with no manual data entry required.
To learn more, visit the Resource Library.