
P&L – Estimate vs Budget
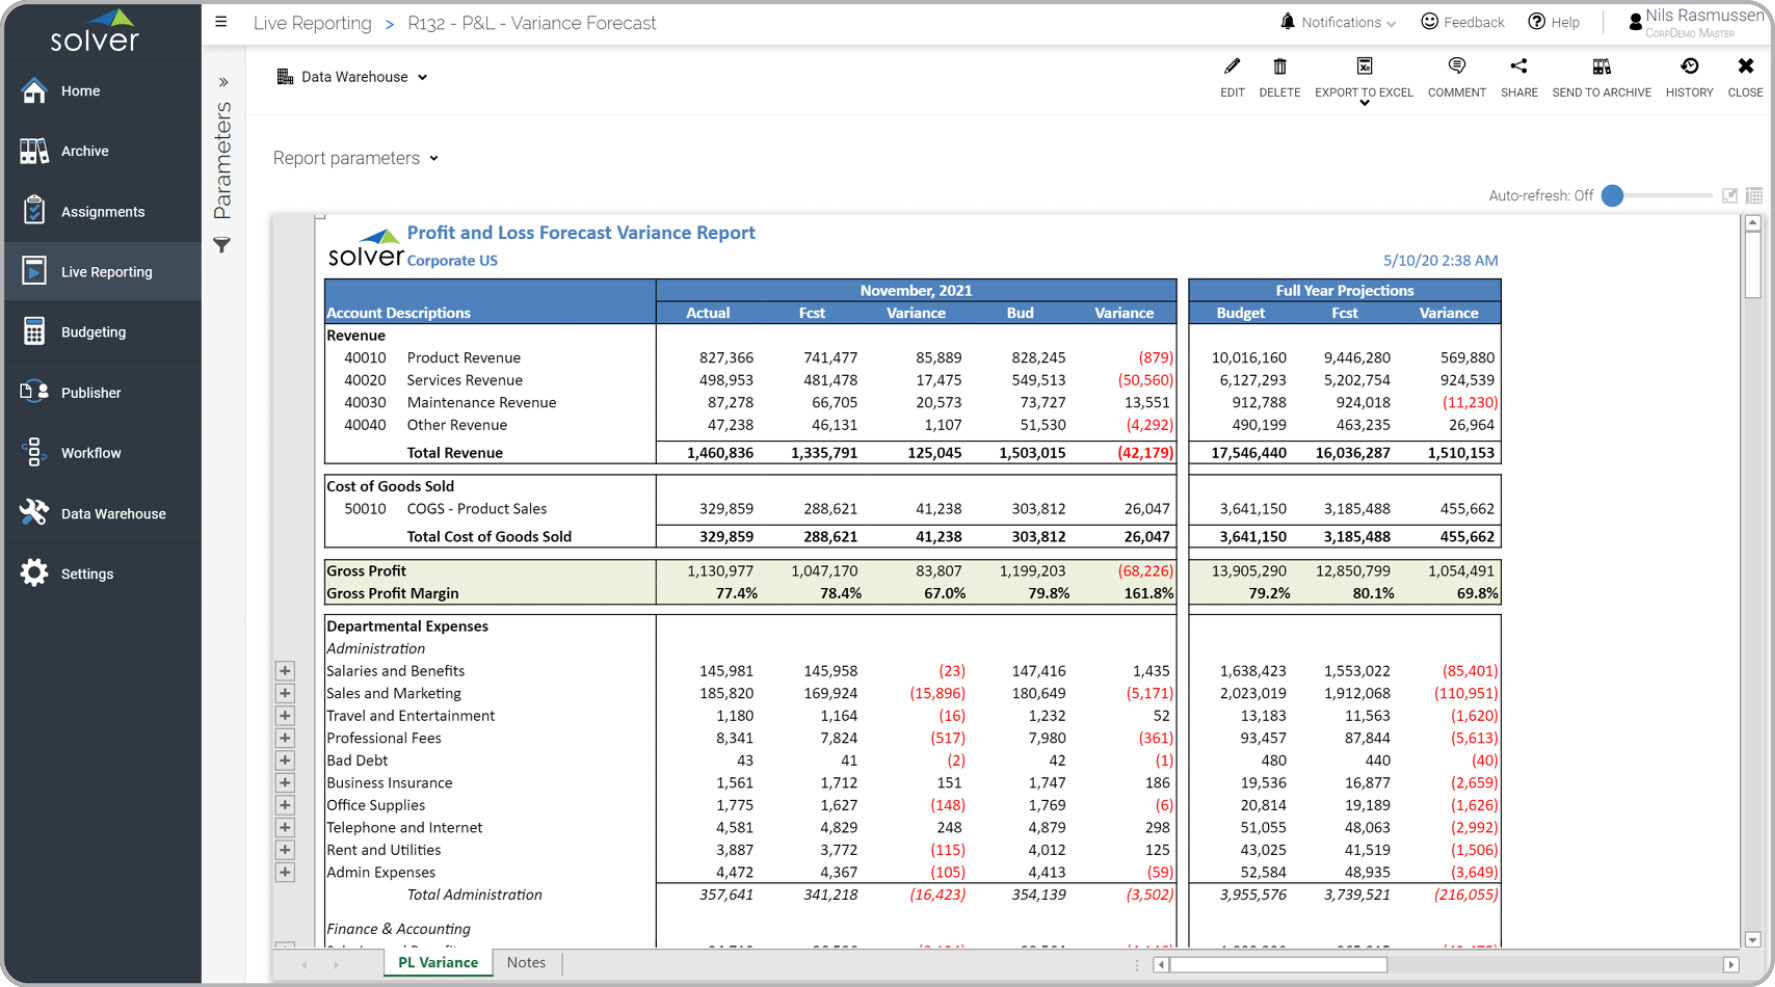
What is a Monthly Profit & Loss Report with Budget and Forecast Variances? Monthly Profit & Loss Variance Reports are considered core financial statements and are often used by executives and financial managers to review month-end results. Key functionality in this type of report provides actual to budget and forecast comparisons for the current period. It also shows the full year budget versus the revised forecast. Rows are grouped by department and can be expanded to view the individual accounts. You will find an example of this type of report below.
Purpose of Profit & Loss Reports with Budget and Forecast Variances Companies and organizations use Profit & Loss Reports with Budget and Forecast Variances to easily view actual revenue, expense and profit performance compared to both the annual budget and the forecast. When used as part of good business practices in a Financial Planning & Analysis (FP&A) Department, a company can improve its monthly and year-end tracking against plan, as well as, reduce the chance that managers lose sight of gaps between current performance versus current and year-end budgets and forecasts.
Who Uses This Type of Report? The typical users of this type of report are: Executives and Department Managers. Other Reports Often Used in Conjunction with Profit & Loss Reports with Budget and Forecast Variances Progressive Financial Planning & Analysis (FP&A) Departments sometimes use several different Profit & Loss Reports with Budget and Forecast Variances, along with balance sheets, cash flow reports and other management and control tools.
Where Does the Data for Analysis Originate From? The Actual (historical transactions) data typically comes from enterprise resource planning (ERP) systems like: Microsoft Dynamics 365 (D365) Finance, Microsoft Dynamics 365 Business Central (D365 BC), Microsoft Dynamics AX, Microsoft Dynamics NAV, Microsoft Dynamics GP, Microsoft Dynamics SL, Sage Intacct, Sage 100, Sage 300, Sage 500, Sage X3, SAP Business One, SAP ByDesign, Acumatica, Netsuite and others. In analyses where budgets or forecasts are used, the planning data most often originates from in-house Excel spreadsheet models or from professional xFP&A solutions.
This Solver planning template connects directly to your ERP data via the Solver Data Warehouse, enabling near real-time analysis with minimal setup. Designed for QuickStart deployment, it can be activated rapidly so your team can focus on analysis and decisions — not data preparation.
What is the P&L – Estimate vs Budget in Solver? The P&L – Estimate vs Budget is a pre-built xFP&A planning template in Solver that allows finance and business teams to submit planning data directly in Solver, with automatic roll-up to consolidated budget and forecast models.
Who uses this Solver planning template? This template is primarily used by CFOs, FP&A managers, and budget owners who need a structured, controlled way to collect and submit planning data in Solver. Department managers and budget owners use it to submit their numbers directly, eliminating manual spreadsheet consolidation.
Where does the data come from? Data is sourced automatically from your ERP system through the Solver Data Warehouse, which integrates with platforms such as Microsoft Dynamics 365 Business Central, Dynamics 365 Finance, Acumatica, Sage Intacct, and other leading ERP solutions. Once connected, the template updates in near real-time with no manual data entry required.
To learn more, visit the Resource Library.