
Nonprofit - KPI Interactive Dashboard
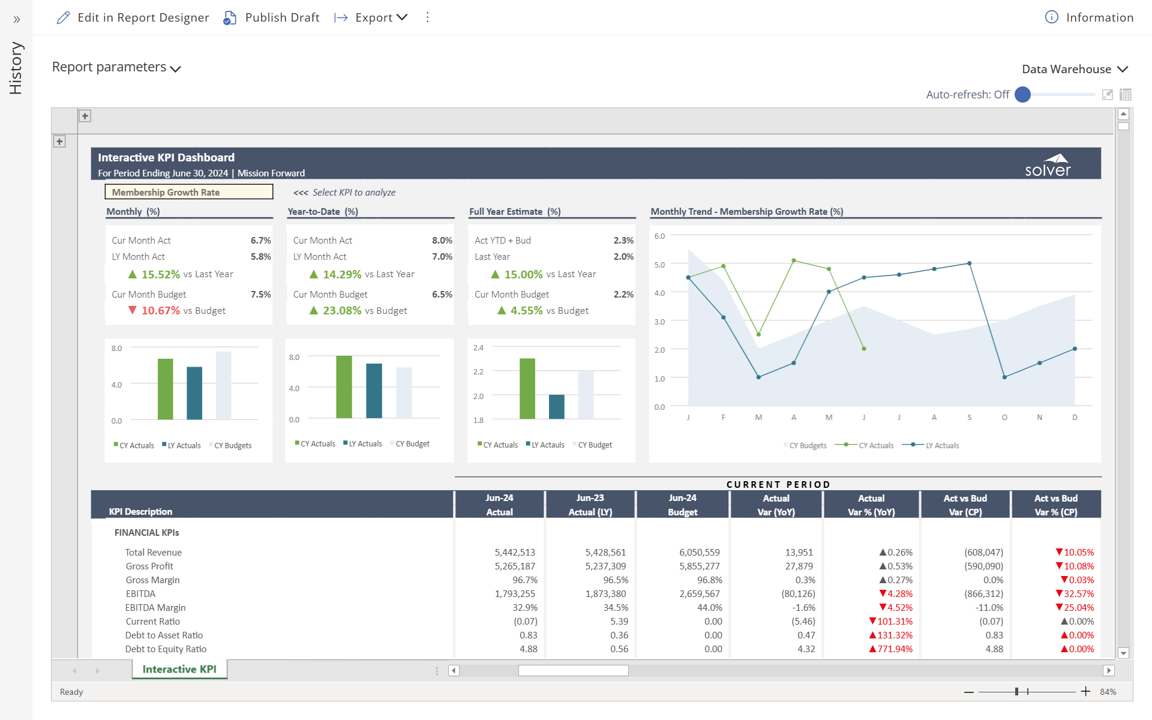
The Nonprofit - KPI Interactive Dashboard in Solver is a pre-built xFP&A dashboard template available in the Solver Template Marketplace for nonprofit. When a user selects a KPI from the dropdown menu in this dashboard , all charts and figures interactively display metrics, including variances and trends for the chosen KPI.
Built for nonprofit finance teams and aligned with Solver's xFP&A platform, this Solver dashboard template connects directly to your ERP data via the Solver Data Warehouse, enabling near real-time analysis with minimal setup. Designed for QuickStart deployment, it can be activated rapidly so your team can focus on analysis and decisions — not data preparation.
What is the Nonprofit - KPI Interactive Dashboard in Solver? The Nonprofit - KPI Interactive Dashboard is a pre-built xFP&A dashboard template in Solver designed for nonprofit organizations. It delivers key financial and operational metrics in a single, easy-to-use interface — purpose-built for nonprofit finance workflows.
Who uses this Solver dashboard template? This template is primarily used by CFOs, controllers, and nonprofit finance teams in nonprofit organizations who need accurate, timely data to support planning, reporting, and decision-making. It is particularly valuable for nonprofit finance teams managing budgets, forecasts, and performance reviews.
Where does the data come from? Data is sourced automatically from your ERP system through the Solver Data Warehouse, which integrates with platforms such as Microsoft Dynamics 365 Business Central, Dynamics 365 Finance, Acumatica, Sage Intacct, and other leading ERP solutions. Once connected, the template updates in near real-time with no manual data entry required.