

View Favorites
GL Exception Dashboard – Profit Margins
Profitability Exception Dashboards to Streamline the Monthly Analysis Process
How can Financial Dashboards Drive Faster and Better Decisions?
As CFOs increasingly become key players in the Monthly Analysis Process, they must rely on modern self-service corporate performance management (CPM) and business intelligence (BI) tools. Using interactive Financial Dashboards like the Profitability Exception Dashboard template shown below enables them and users from the leadership team to experience near real time profit and margin outliers that help drive faster and better decisions.
Who uses Profitability Exception Dashboards and What are Some Key Analytical Features?
In today’s fast-paced business environment, CFOs are under high pressure to supply end users like board members and executives with timely and concise Financial Dashboards. Companies use key features like the ones below to support their users with effective analysis that helps drive sales strategies and expense management.
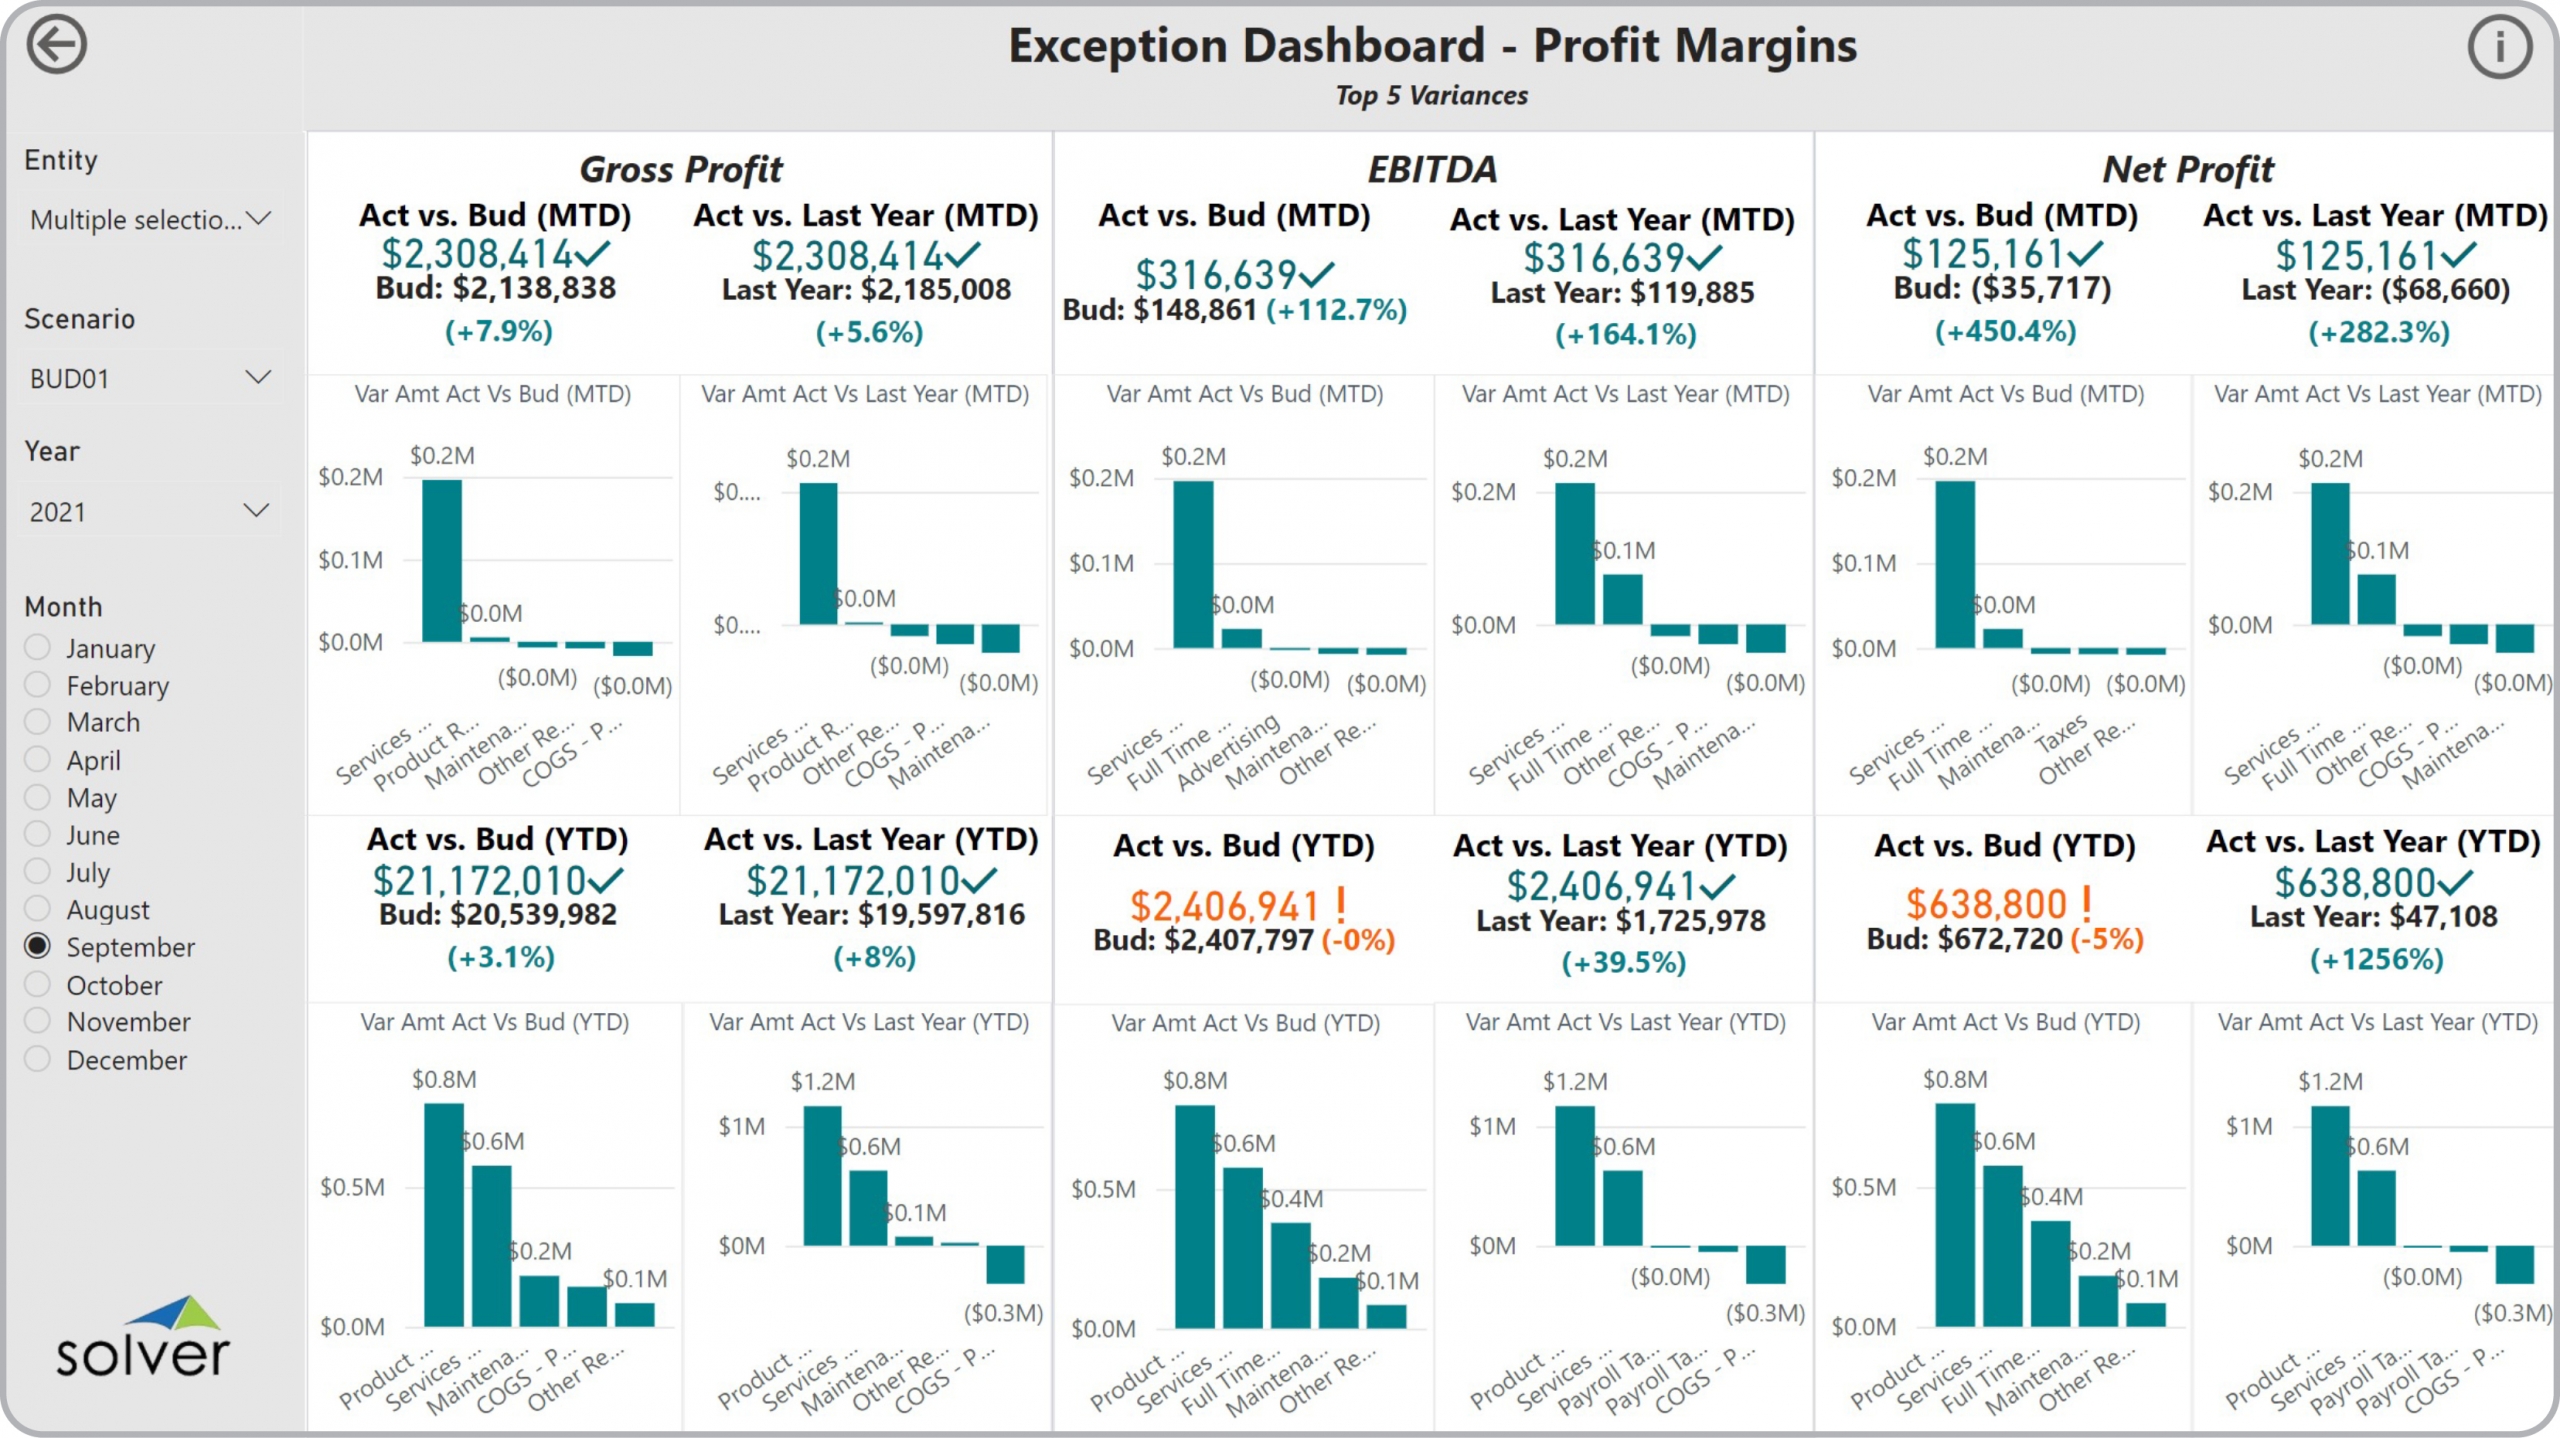
- Year-to-date (YTD) gross profit, EBITDA and Net Profit metrics
- Top five GL account level variances related to each profitability metric
- Ranked charts based on amount of variance vs prior year and budget
View Favorites