

View Favorites
GL Dashboard – 8 Quarter Profitability Trend
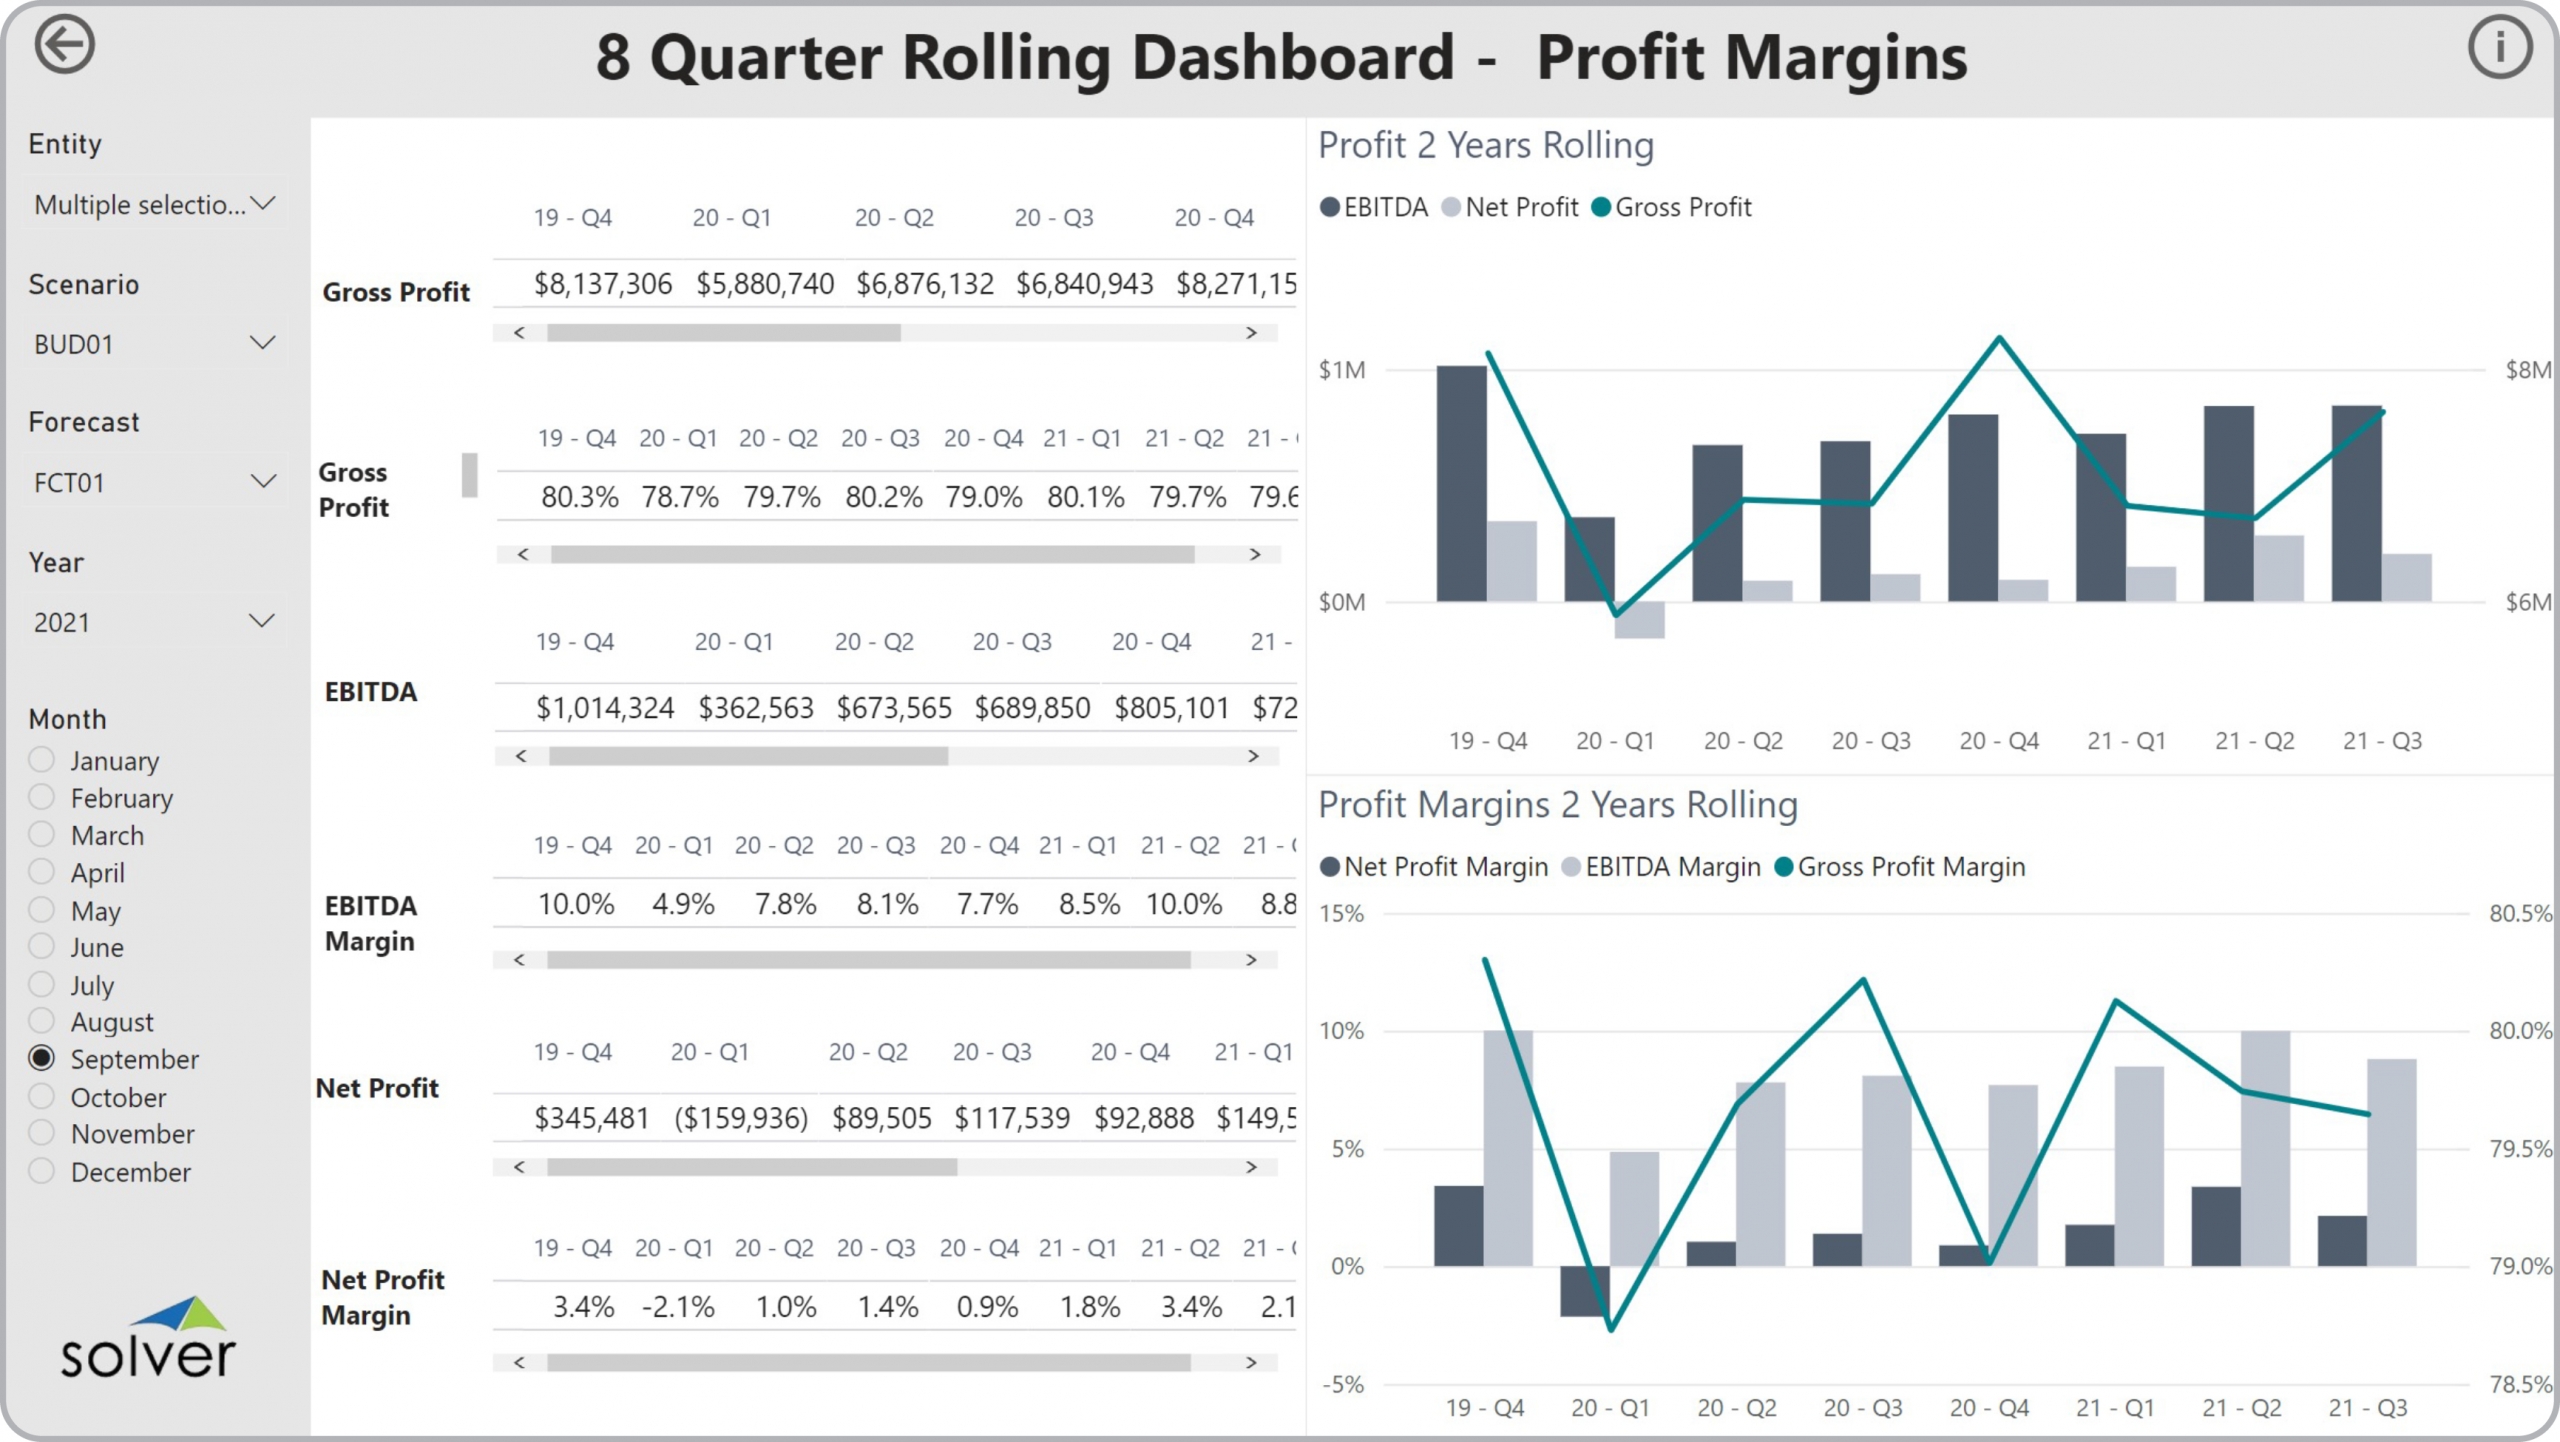
8 Quarter Rolling Profit Margin Dashboards to Streamline the Monthly Reporting Process
How can Financial Dashboards Drive Faster and Better Decisions?
As CFOs increasingly become key advisors in the Monthly Reporting Process, they must rely on modern self-service corporate performance management (CPM) and business intelligence (BI) tools. Using interactive Financial Dashboards like the 8 Quarter Rolling Profit Margin Dashboard template shown below enables them and users from the executive team to experience near real time profitability trend analysis that help drive faster and better decisions.
Who uses 8 Quarter Rolling Profit Margin Dashboards and What are Some Key Analytical Features?
In today’s fast-paced business environment, CFOs are under high pressure to supply end users like executives and board members with timely and concise Financial Dashboards. Companies use key features like the ones below to support their users with effective analysis that helps drive profit optimization and growth strategies:
- Profit-related KPI metrics for the most recent 8 quarters
- The current quarter automatically displayed as quarter-to-date (QTD) figure and charts
- Trend charts to compare profit metrics
View Favorites