

View Favorites
GL Dashboard – 48 Month KPI Trend
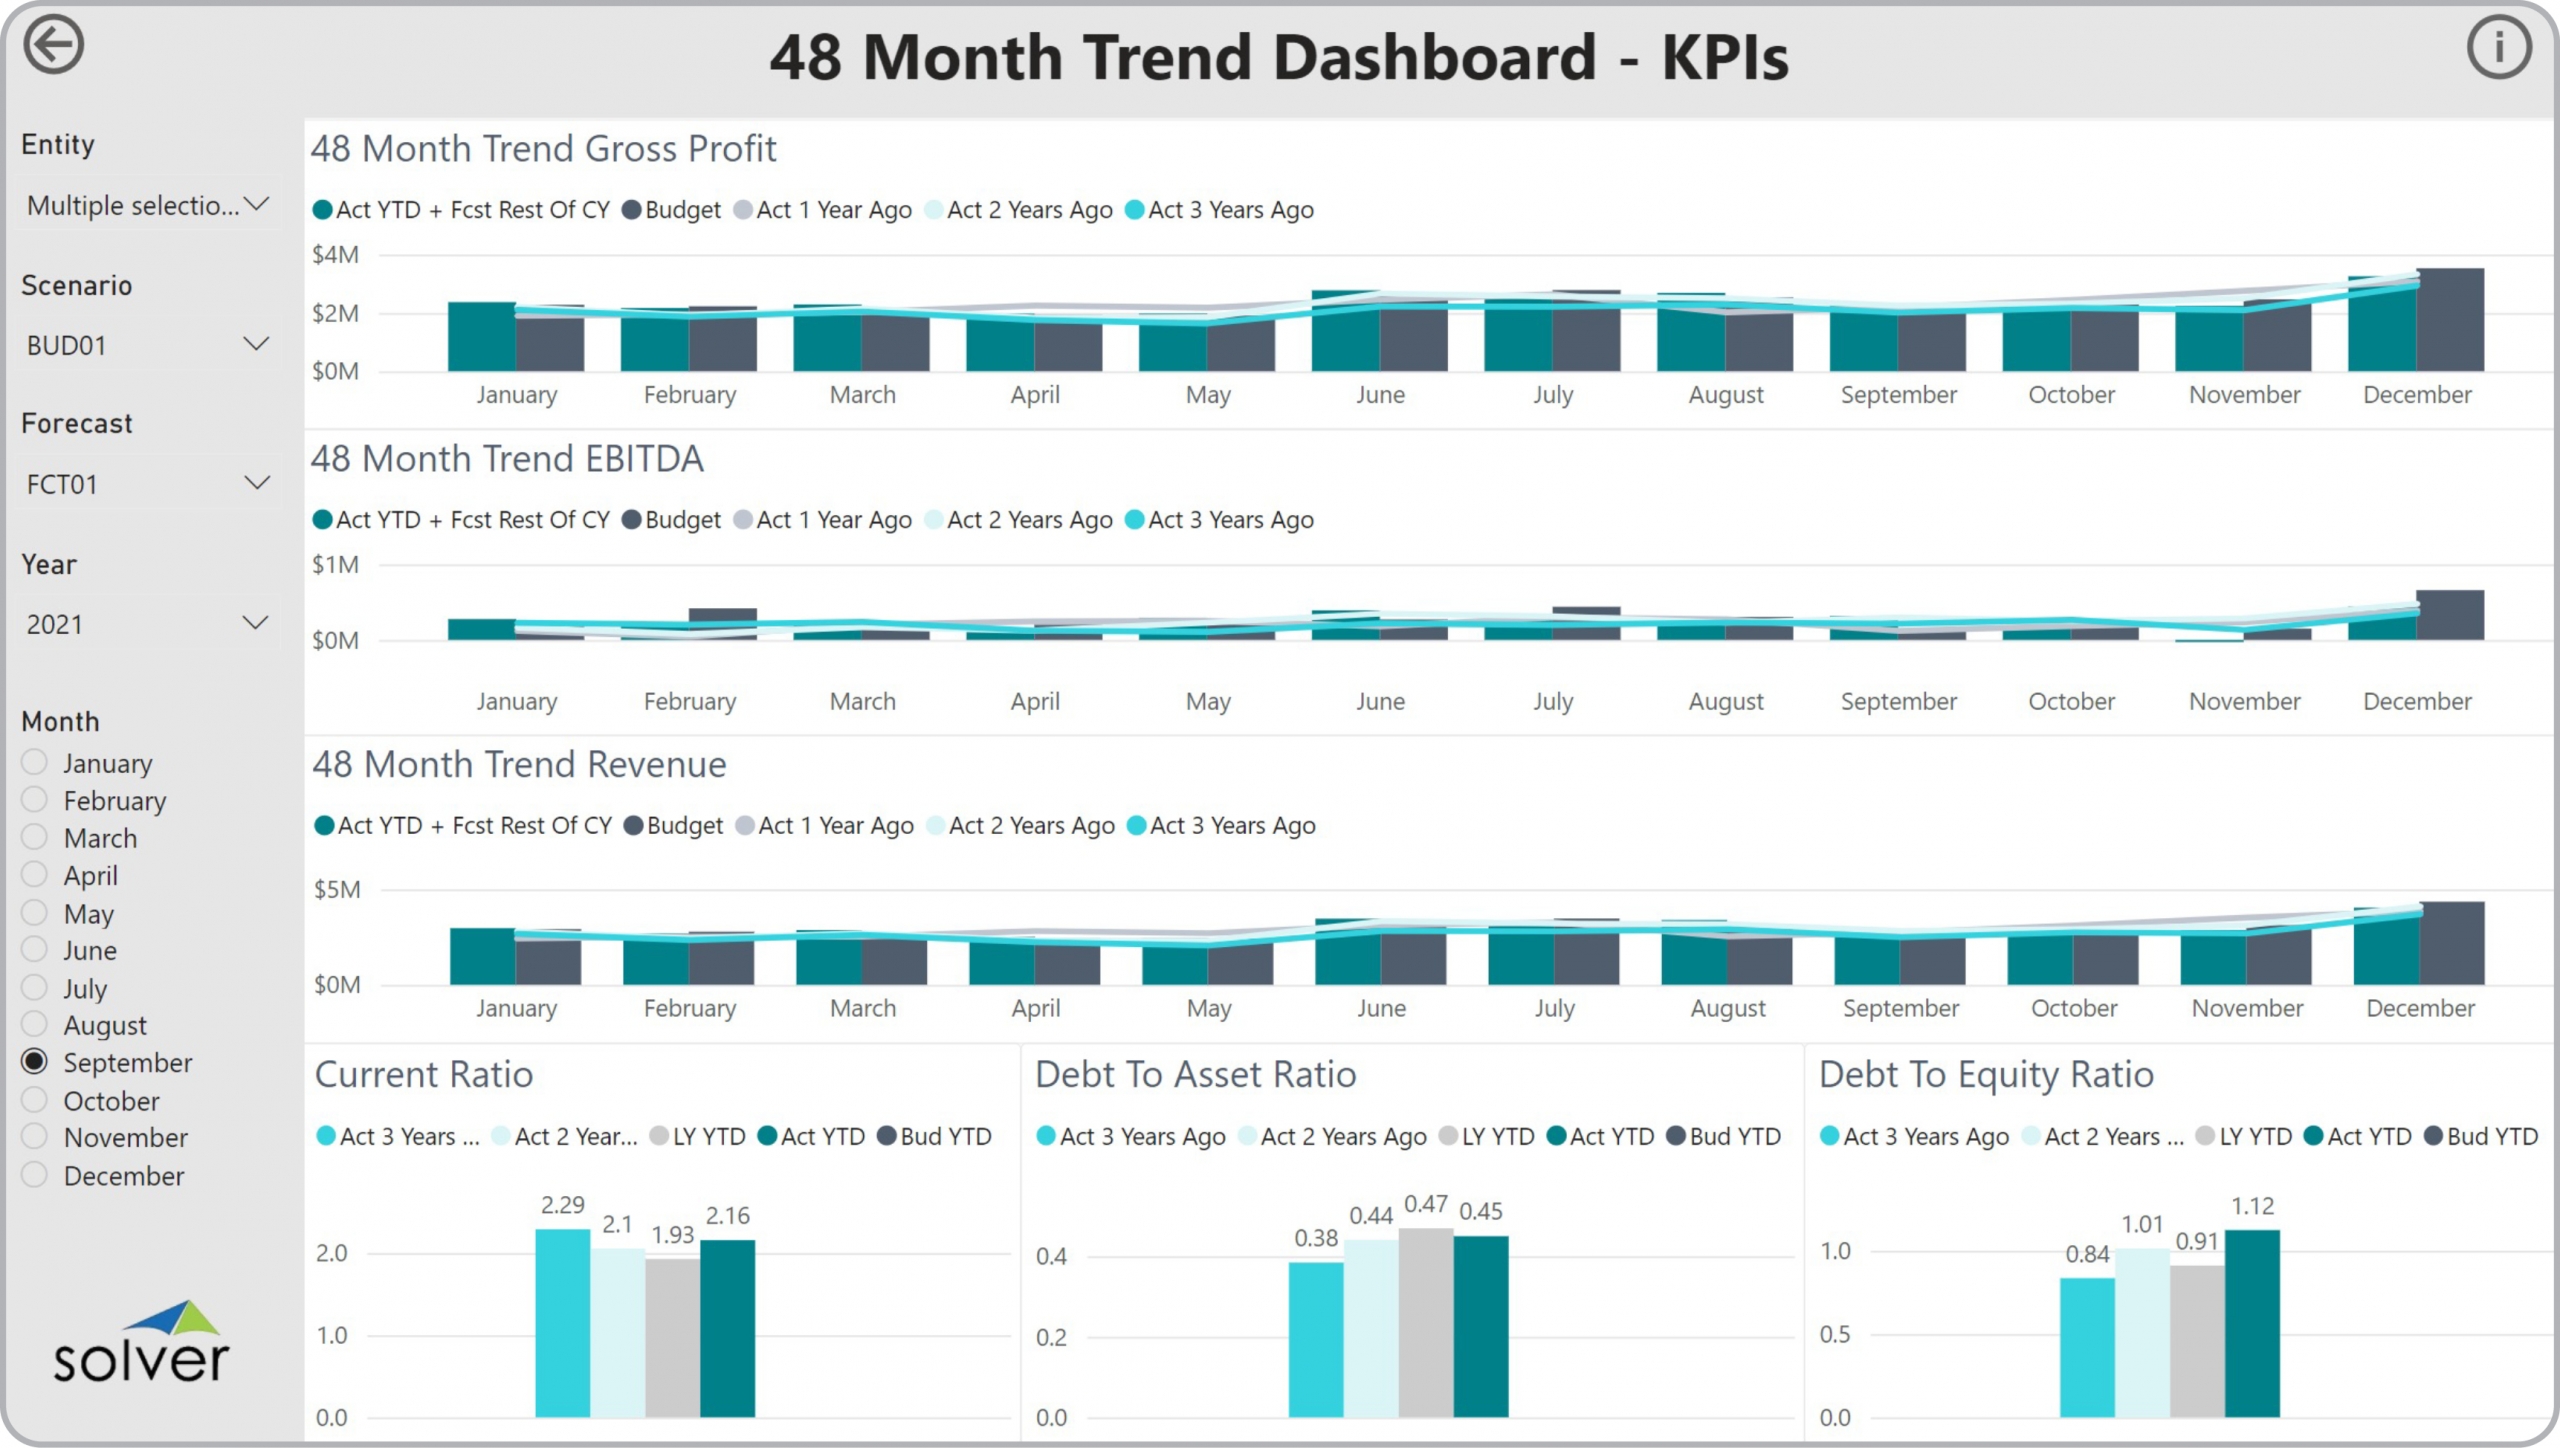
48 Month KPI Trend Dashboards to Streamline the Monthly Reporting Process
How can Financial Dashboards Drive Faster and Better Decisions?
As CFOs increasingly become key players in the Monthly Reporting Process, they must rely on modern self-service corporate performance management (CPM) and business intelligence (BI) tools. Using interactive Financial Dashboards like the 48 Month KPI Trend Dashboard template shown below enables them and users from the executive team to experience near real time financial trend analysis that help drive faster and better decisions.
Who uses 48 Month KPI Trend Dashboards and What are Some Key Analytical Features?
In today’s fast-paced business environment, CFOs are under high pressure to supply end users like executives and board members with timely and concise Financial Dashboards. Companies use key features like the ones below to support their users with effective analysis that helps drive faster and more informed decisions:
- Side-by-side, annual trend comparison of three important balance sheet ratios
- Monthly trends charts with budget and four years of history for revenue and profitability metrics
- Automated full year revenue and profit estimate based on actual year-to-date plus budget/forecast for the remainder of the year
View Favorites