

View Favorites
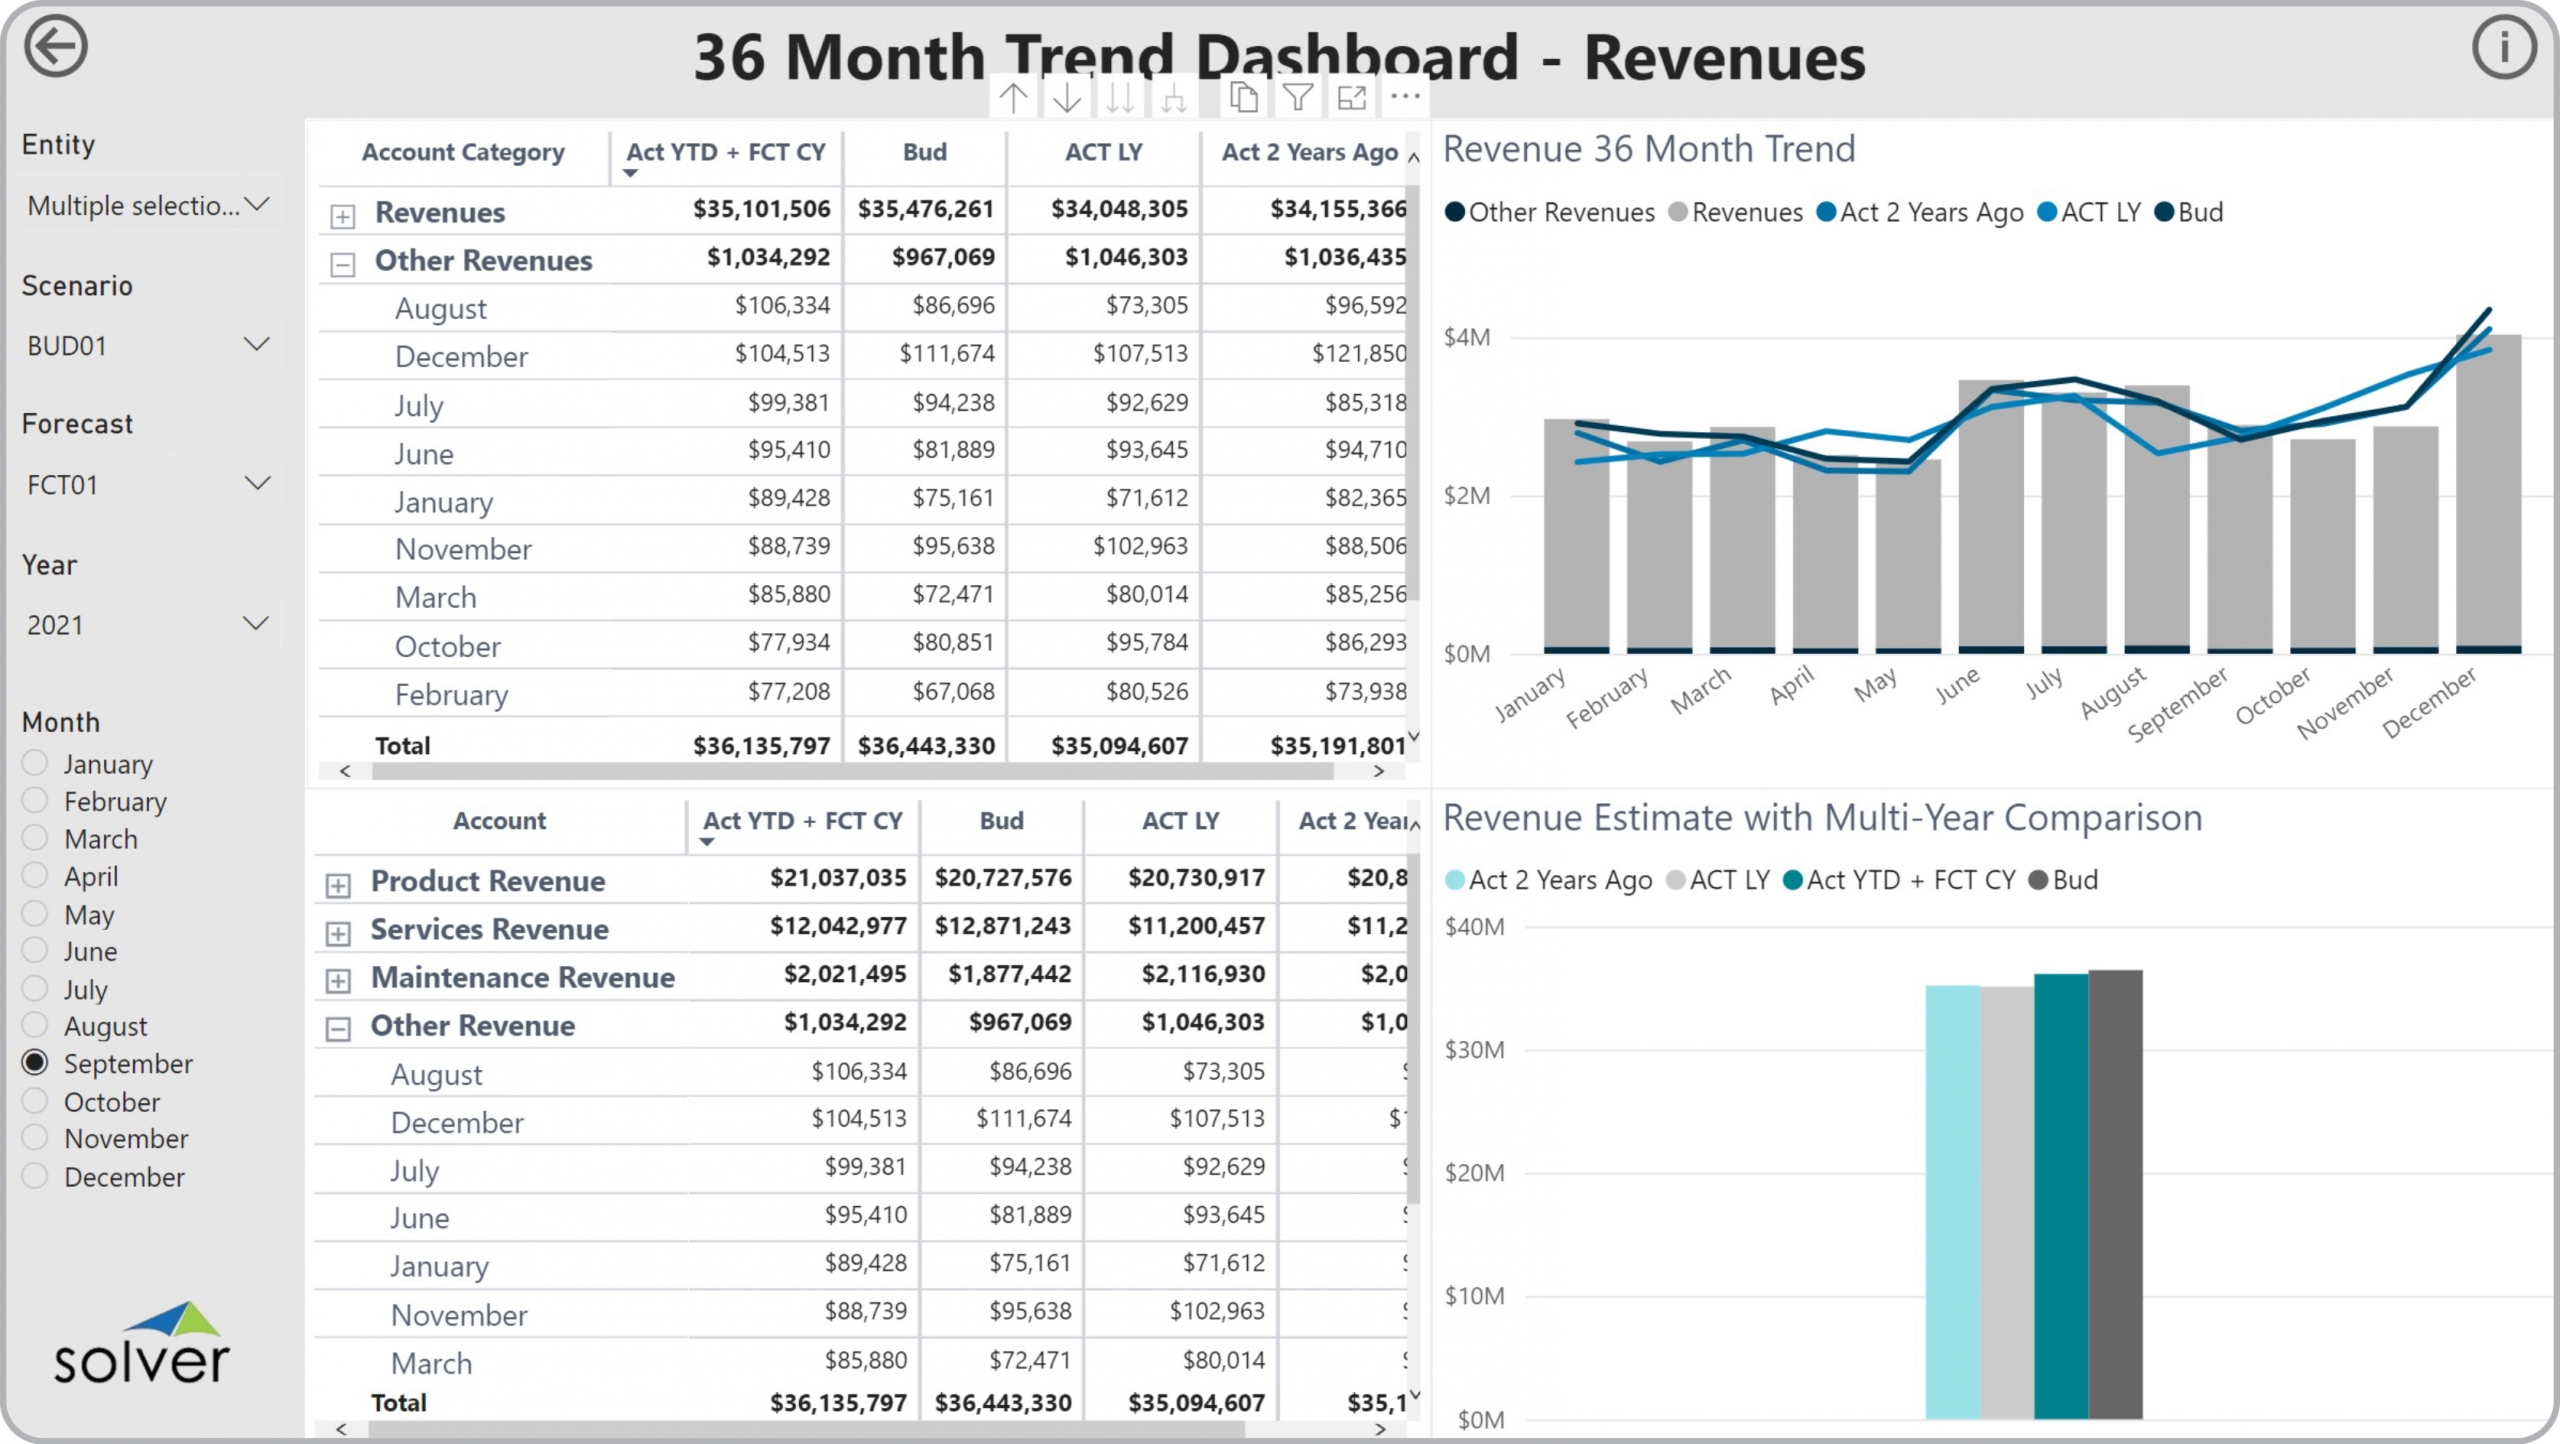
GL Dashboard – 36 Month Revenue Trend
36 Month Revenue Trend Dashboards to Streamline the Monthly Reporting Process
How can Financial Dashboards Drive Faster and Better Decisions?
As CFOs increasingly become key advisors in the Monthly Reporting Process, they must rely on modern self-service corporate performance management (CPM) and business intelligence (BI) tools. Using interactive Financial Dashboards like the 36 Month Revenue Trend Dashboard template shown below enables them and users from the executive team to experience near real time revenue trend analysis that help drive faster and better decisions.
Who uses 36 Month Revenue Trend Dashboards and What are Some Key Analytical Features?
In today’s fast-paced business environment, CFOs are under high pressure to supply end users like senior leaders and board members with timely and concise Financial Dashboards. Companies use key features like the ones below to support their users with effective analysis that helps drive improved sales and liquidity planning:
- Trend analysis with three years of actual data as well as current year budget
- Ranking by revenue account and category
- Variance analysis with multi-year history and budgets
View Favorites