

View Favorites
GL Combo Dashboard – Profitability
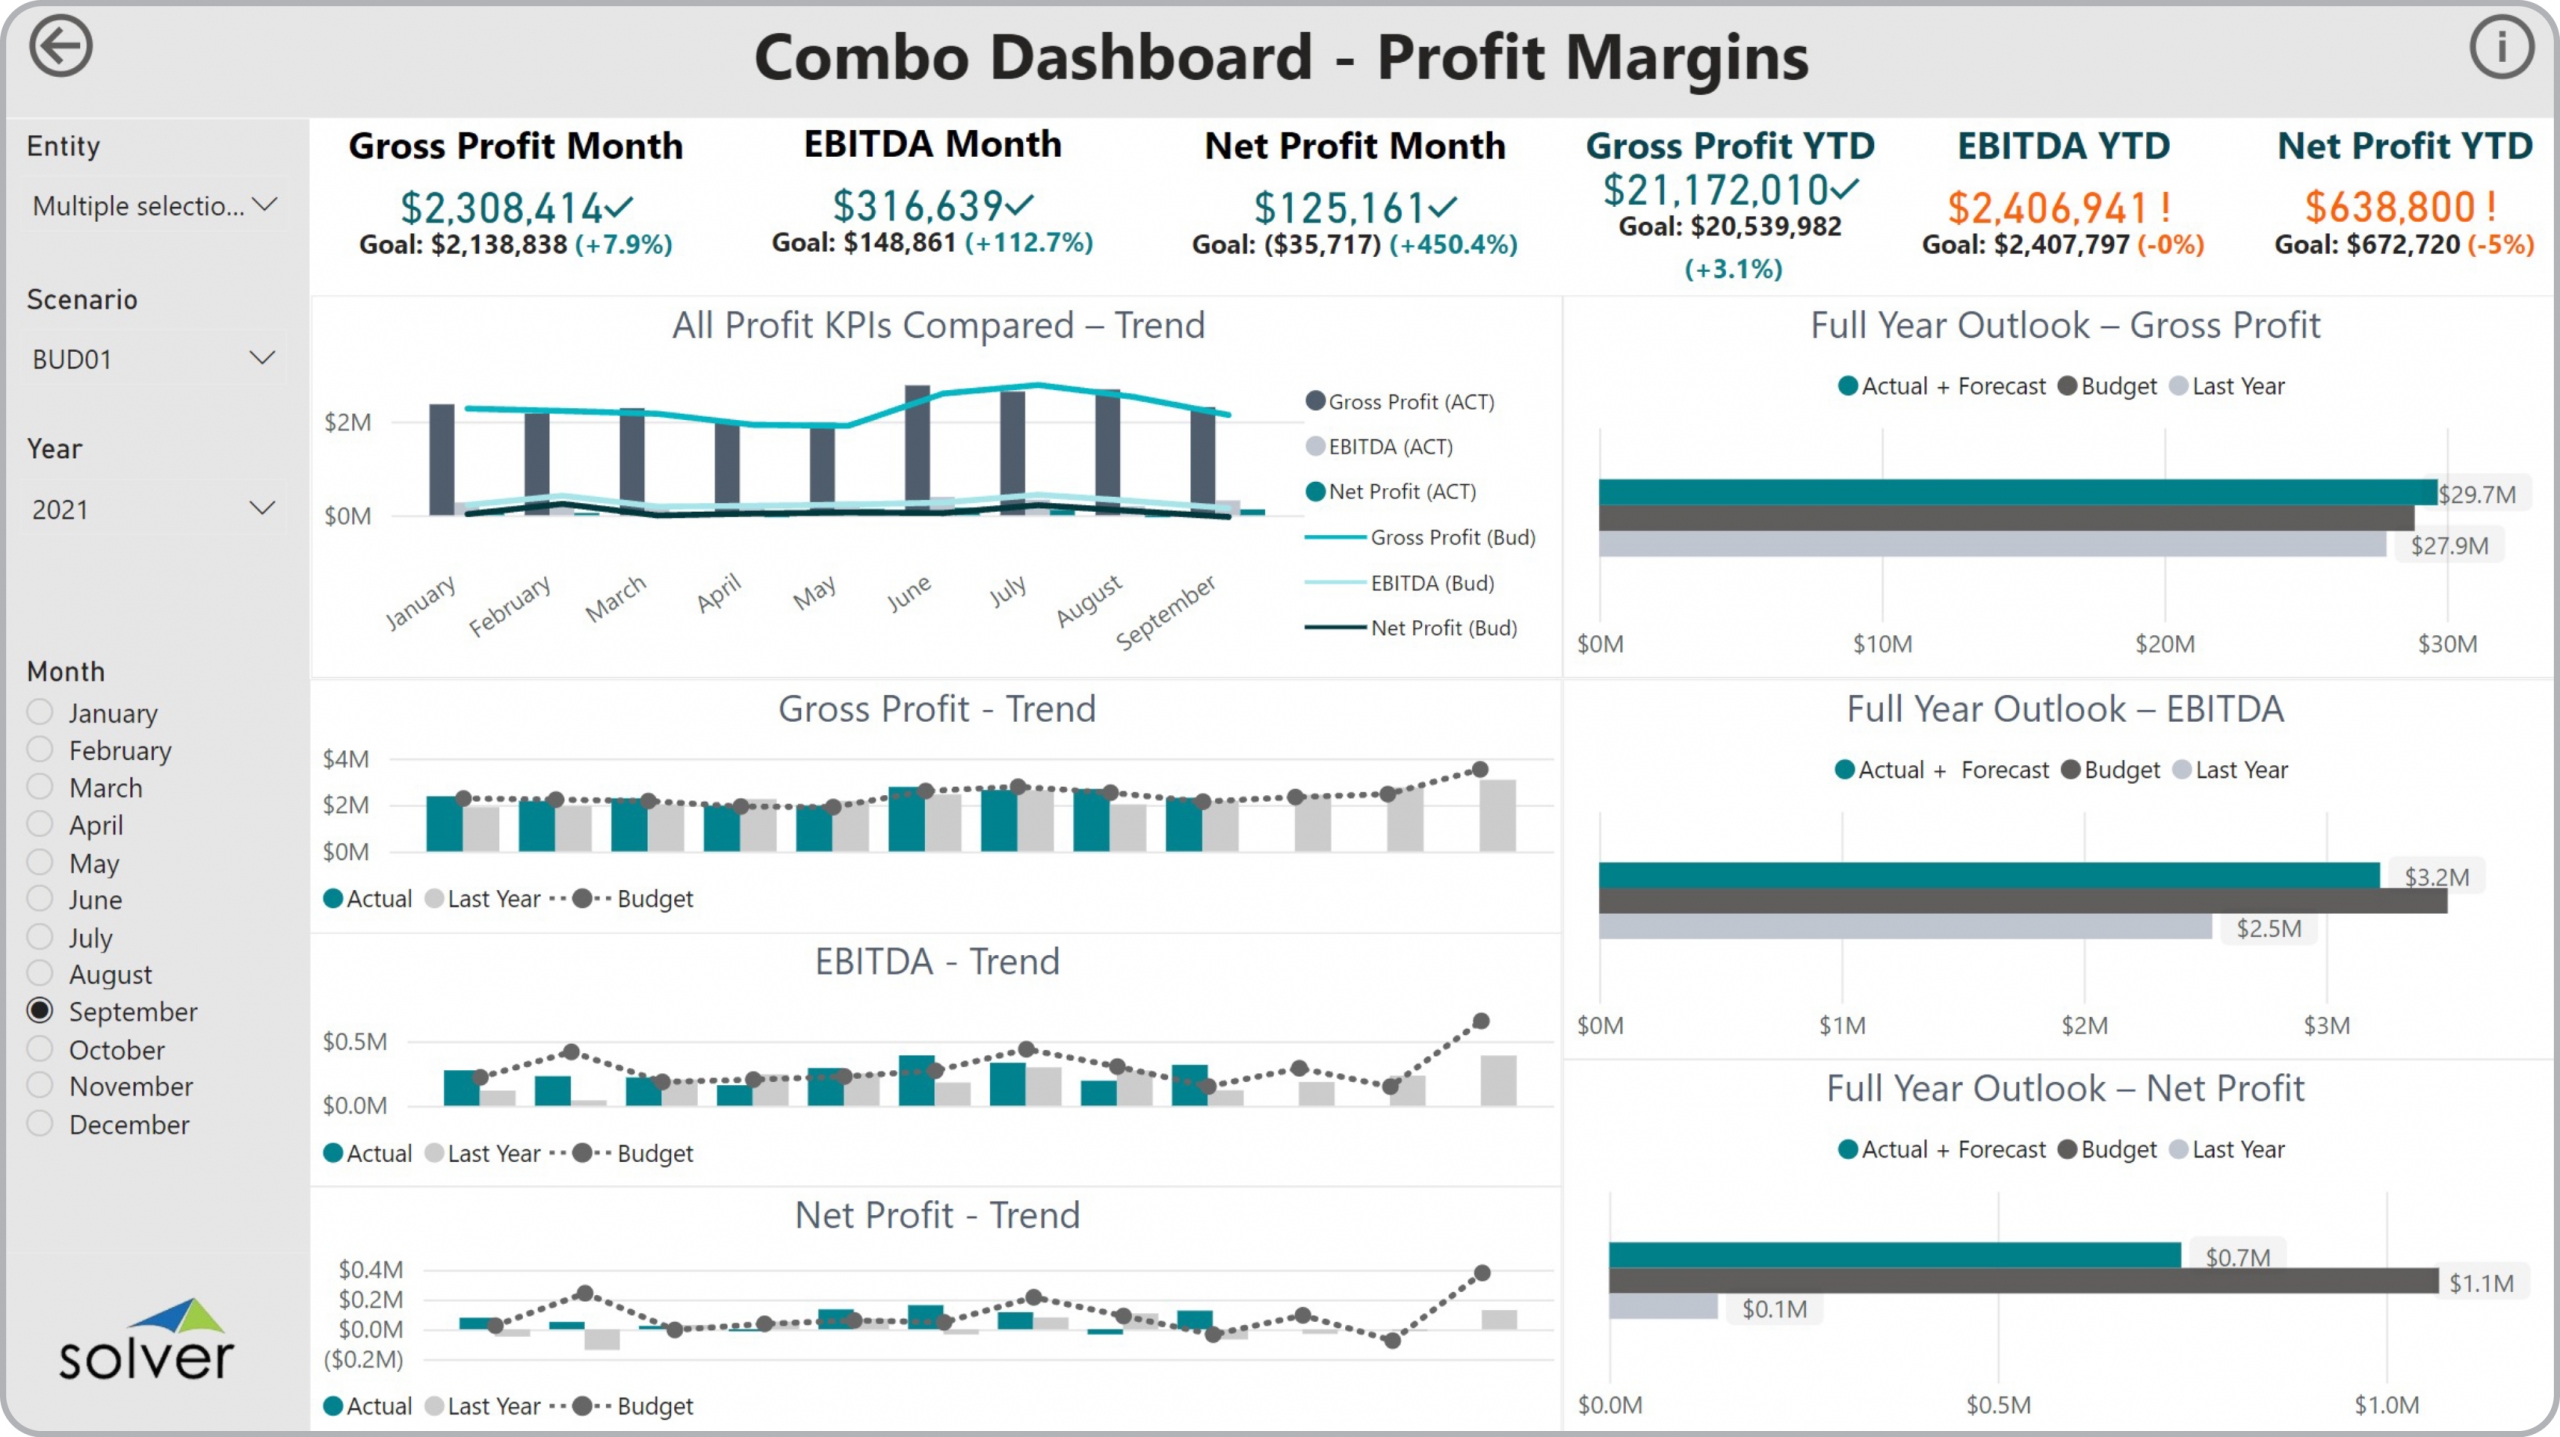
Profitability Comination Dashboards to Streamline the Monthly Reporting Process
How can Financial Dashboards Drive Faster and Better Decisions?
As CFOs increasingly become key players in the Monthly Reporting Process, they must rely on modern self-service corporate performance management (CPM) and business intelligence (BI) tools. Using interactive Financial Dashboards like the Combination Profitability Trend Dashboard template shown below enables them and other users from the executive team to experience near real time profitability trend analysis that help drive faster and better decisions.
Who uses Combination Profitability Trend Dashboards and What are Some Key Analytical Features?
In today’s fast-paced business environment, CFOs are under high pressure to supply end users like executives and analysts with timely and concise Financial Dashboards. Companies use key features like the ones below to support their users with effective analysis that helps drive profit maximization and growth tactics:
- Combination of charts, graphs, and tables
- Trend analysis with Combination of actual data as well as current year budget
- Automated estimate for current year that combines actual YTD with forecast for the remaining months
- Comparison of Overview history and budgets
View Favorites