
Credit Union – Securities Listing by Category
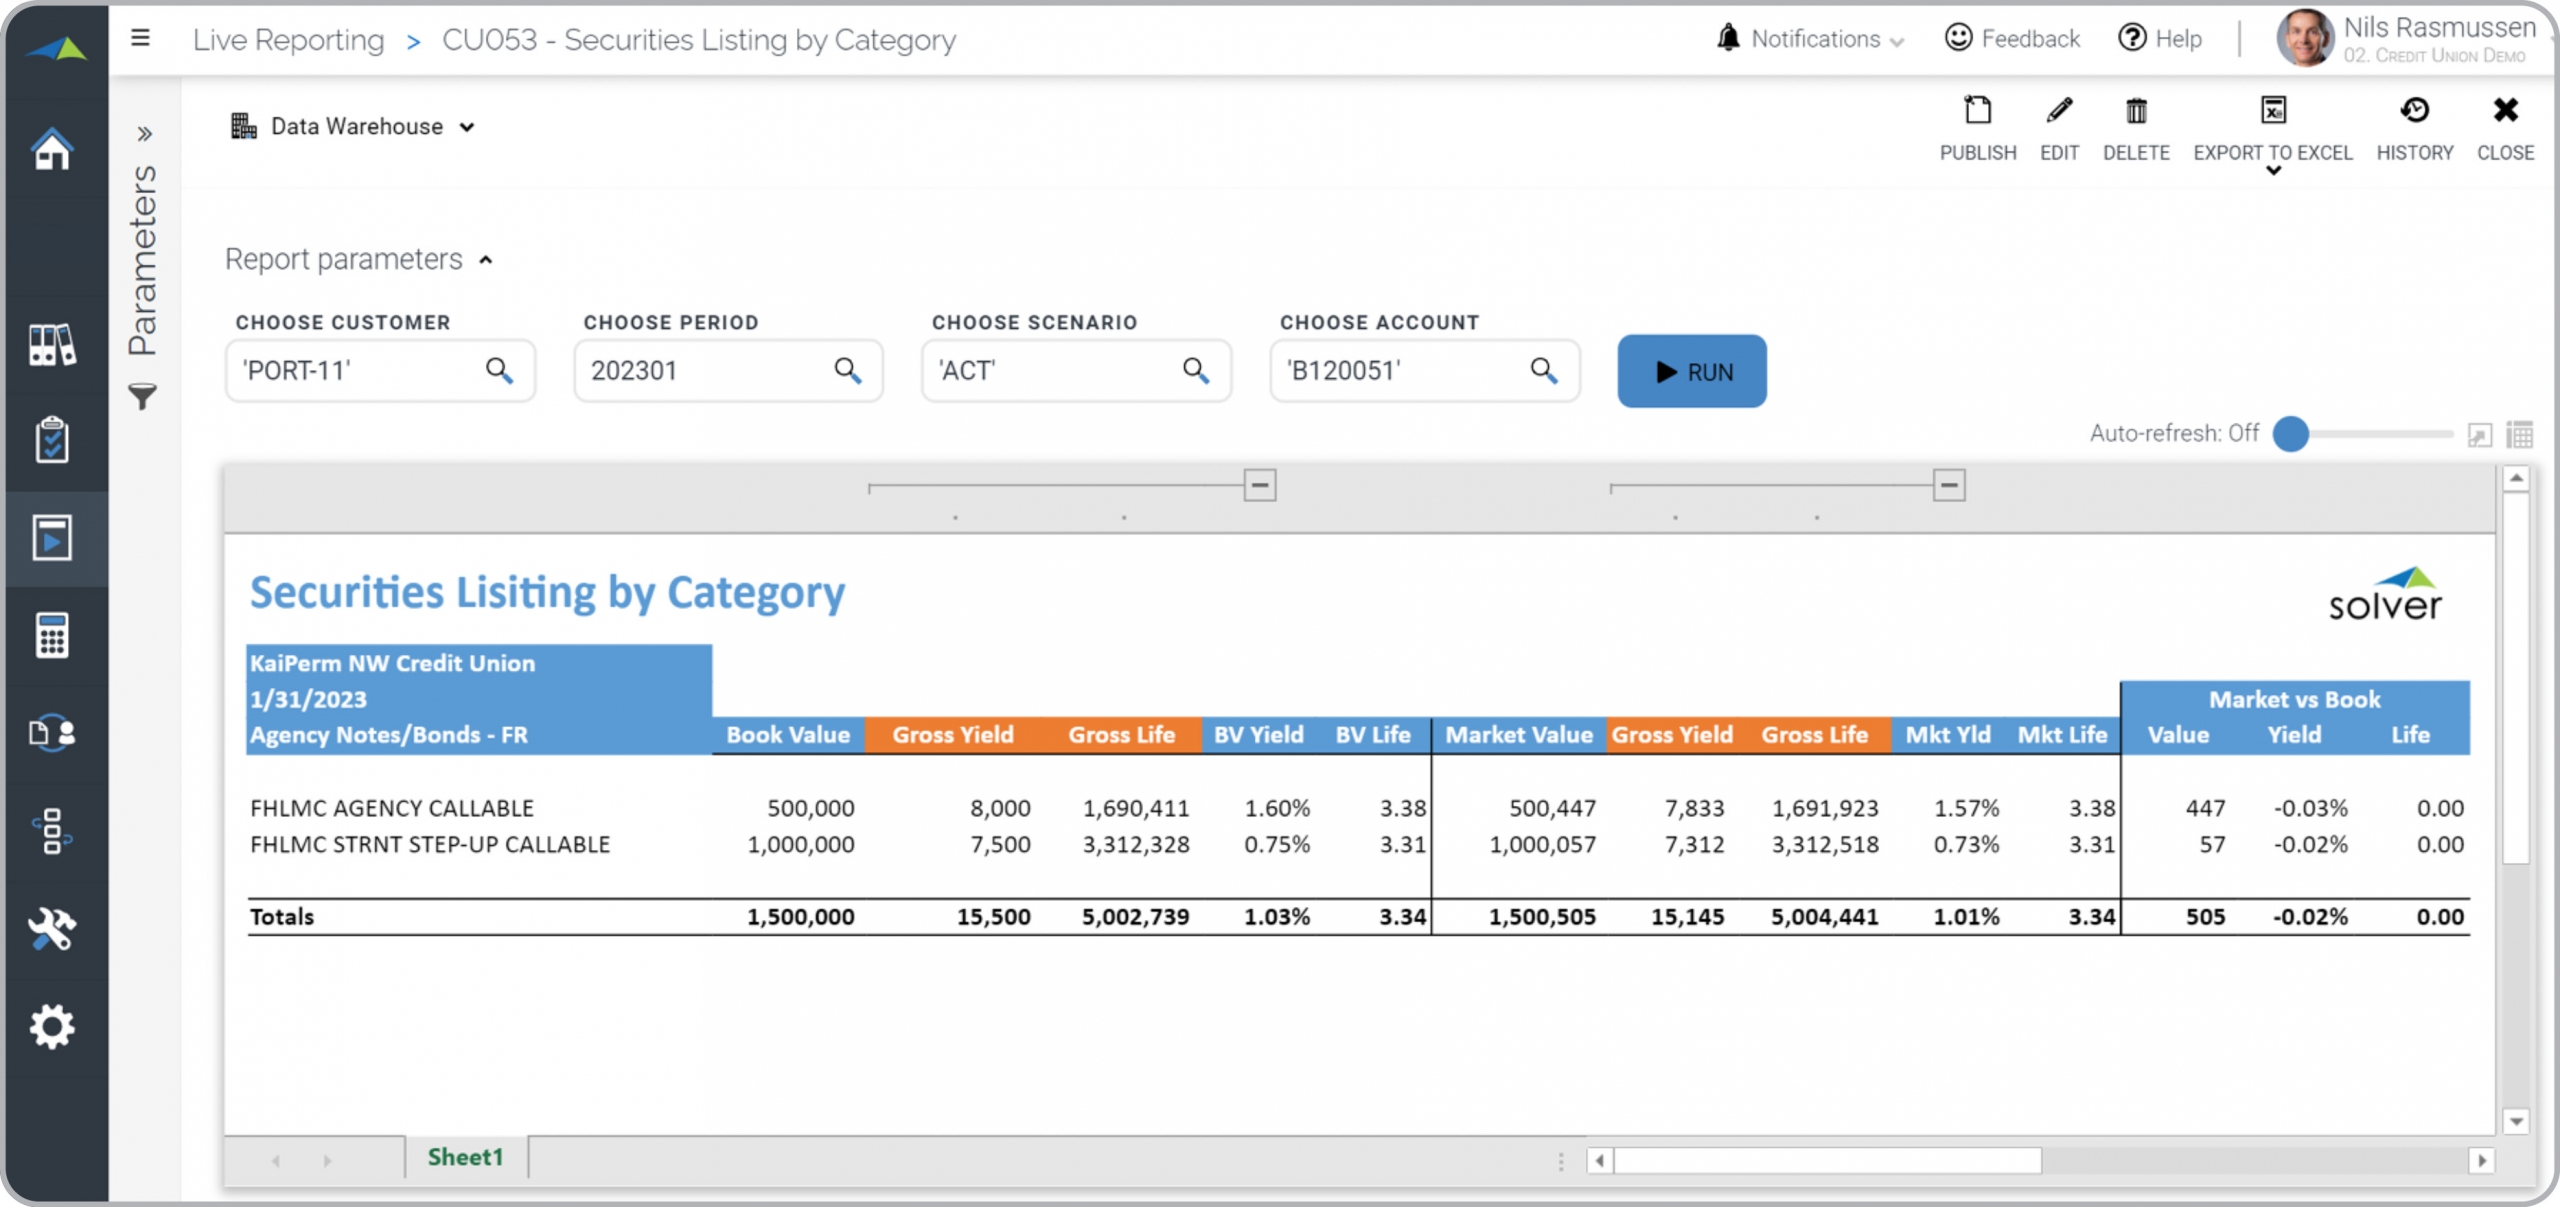
What is a Securities by Category Report? Securities Reports are considered portfolio analysis tools and are used by investment managers and analysts to analyze market- and book values of different security categories. Some of the main functionality in this type of report is that it is parameter driven and for any select group of securities it displays book- and market values as well as variances between these. The security categories are listed in the rows. Across the columns you find: Book value and its yield and life metrics, market value with yield and life metrics, and variances between book and life metrics. You find an example of this type of report below.
Purpose of Securities by Category Reports Credit Unions use Securities by Category Reports to analyze book- and market value KPIs and variances. When used as part of good business practices in Investment- and Finance departments, a company can improve its securities strategies and profitability, and it can reduce the chances that a lack of easy on-demand reports reduces the ability to make faster and better decisions.
Who Uses This Type of Report? The typical users of this type of report are: Investment managers, securities portfolio managers, analysts. Other Reports Often Used in Conjunction with Securities by Category Reports Progressive Investment- and Finance departments sometimes use several different Securities by Category Reports, along with securities transaction reports, investment dashboards, KPI dashboards, securities dashboards and other management and control tools.
Where Does the Data for Analysis Originate From? The Actual (historical transactions) data typically comes from portfolio management software and enterprise resource planning (ERP) systems like: Microsoft Dynamics 365 (D365) Finance, Microsoft Dynamics 365 Business Central (D365 BC), Microsoft Dynamics AX, Microsoft Dynamics NAV, Microsoft Dynamics GP, Microsoft Dynamics SL, Sage Intacct, Sage 100, Sage 300, Sage 500, Sage X3, SAP Business One, SAP ByDesign, Acumatica, Netsuite and others. In analyses where budgets or forecasts are used, the planning data most often originates from in-house Excel spreadsheet models or from professional xFP&A solutions.
Built for credit union finance teams and aligned with Solver's xFP&A platform, this Solver report template connects directly to your ERP data via the Solver Data Warehouse, enabling near real-time analysis with minimal setup. Designed for QuickStart deployment, it can be activated rapidly so your team can focus on analysis and decisions — not data preparation.
What is the Credit Union – Securities Listing by Category in Solver? The Credit Union – Securities Listing by Category is a pre-built xFP&A report template in Solver designed for credit union organizations. It delivers key financial and operational metrics in a single, easy-to-use interface — purpose-built for credit union finance workflows.
Who uses this Solver report template? Finance leaders at credit union organizations — including CFOs, finance managers, and credit union executives — use this template to get fast, reliable answers without waiting on IT or building custom reports. It supports both day-to-day monitoring and strategic decision-making.
Where does the data come from? Data is sourced automatically from your ERP system through the Solver Data Warehouse, which integrates with platforms such as Microsoft Dynamics 365 Business Central, Dynamics 365 Finance, Acumatica, Sage Intacct, and other leading ERP solutions. Core banking and loan origination systems are also supported as data sources. Once connected, the template updates in near real-time with no manual data entry required.
To learn more, visit the Resource Library.