
Campaign Profitability Report
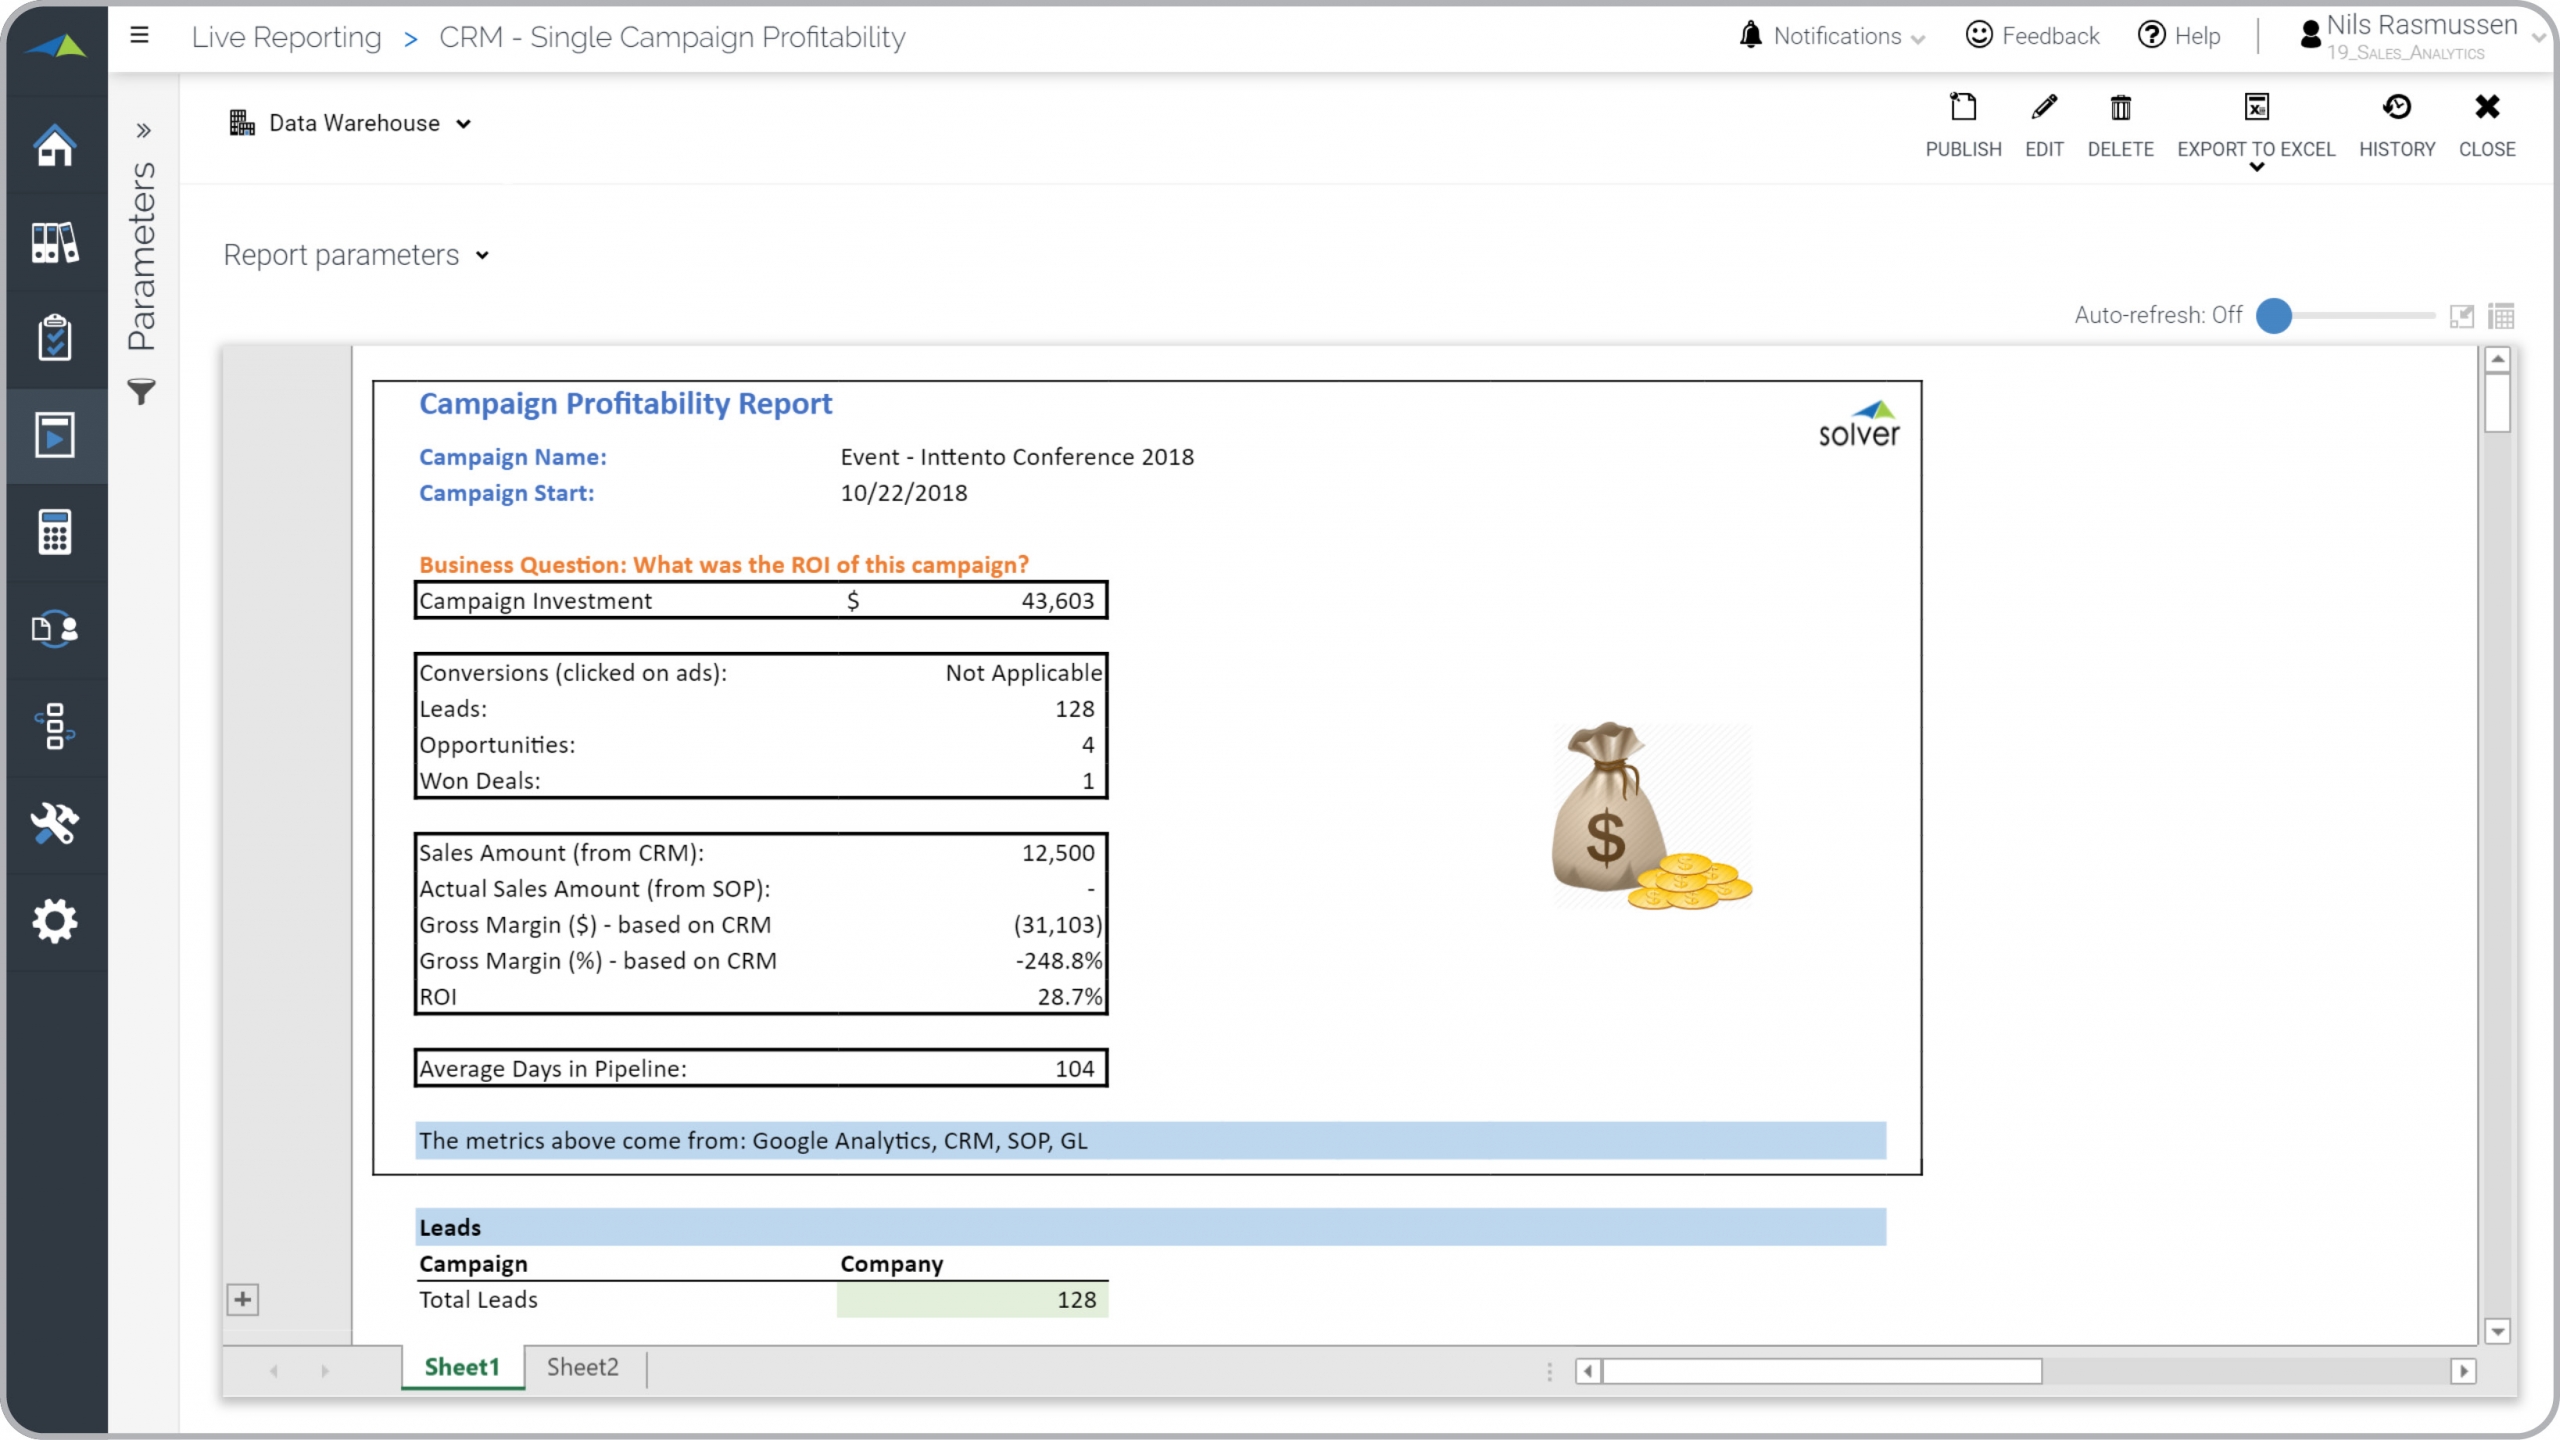
What is a Marketing Campaign Profitability Report? Campaign profitability reports are considered financial and marketing analysis tools and are often used by marketing executives to understand how profitable (or not!) their marketing activities are. Some of the key functionality in this type of report is that it combines data from the company's CRM system and ERP system to calculate the gross margin contribution of each campaign. The user can select a campaign and then run the report. On the top it shows the cost of the campaign, then it shows how many leads it drove and how many opportunities and won deals this resulted in. Then it brings in the estimated sales amount (from closing a deal in the CRM system) and the actual sales amount (recorded in the ERP system). These figures are then used to calculate the Gross Margin amount and percent as well as the return on investment (ROI). The bottom of the report (not visible in the screenshot below) includes drill down to lead/opportunity and sales transactions. You find an example of this type of report below.
Purpose of Campaign Profitability Reports Companies and organizations use Campaign Profitability Reports to automatically see the actual profitability of their marketing activities. When used as part of good business practices in a Marketing department, a company can improve its sales and control expenses by intelligently choosing the marketing campaigns with the best gross margins as well as reduce the chances that money is repetitively wasted on poor marketing activities.
Who Uses This Type of Report? The typical users of this type of report are: Marketing executives and campaign managers. Other Reports Often Used in Conjunction with Campaign Profitability Reports Progressive Marketing Departments sometimes use several different Campaign Profitability Reports, along with marketing department profit & loss statements, overhead allocation reports, marketing simulation models, marketing dashboards, marketing budgets and other management and control tools.
Where Does the Data for Analysis Originate From? The Actual (historical transactions) data typically comes from enterprise resource planning (ERP) systems like: Microsoft Dynamics 365 (D365) Finance, Microsoft Dynamics 365 Business Central (D365 BC), Microsoft Dynamics AX, Microsoft Dynamics NAV, Microsoft Dynamics GP, Microsoft Dynamics SL, Sage Intacct, Sage 100, Sage 300, Sage 500, Sage X3, SAP Business One, SAP ByDesign, Acumatica, Netsuite and others. In analyses where budgets or forecasts are used, the planning data most often originates from in-house Excel spreadsheet models or from professional xFP&A solutions.
This Solver report template connects directly to your ERP data via the Solver Data Warehouse, enabling near real-time analysis with minimal setup. Designed for QuickStart deployment, it can be activated rapidly so your team can focus on analysis and decisions — not data preparation.
What is the Campaign Profitability Report in Solver? The Campaign Profitability Report is a pre-built xFP&A report template in Solver that delivers key financial and operational metrics in a single, easy-to-use interface, eliminating the need for manual data work or custom report development.
Who uses this Solver report template? Cfos, fp&a managers, and controllers rely on this Solver report template for consistent, parameter-driven reporting that can be run on demand or on a scheduled basis. It eliminates the manual work typically required to produce this type of analysis.
Where does the data come from? Data is sourced automatically from your ERP system through the Solver Data Warehouse, which integrates with platforms such as Microsoft Dynamics 365 Business Central, Dynamics 365 Finance, Acumatica, Sage Intacct, and other leading ERP solutions. Once connected, the template updates in near real-time with no manual data entry required.
To learn more, visit the Resource Library.