
Benchmark Comparison Report
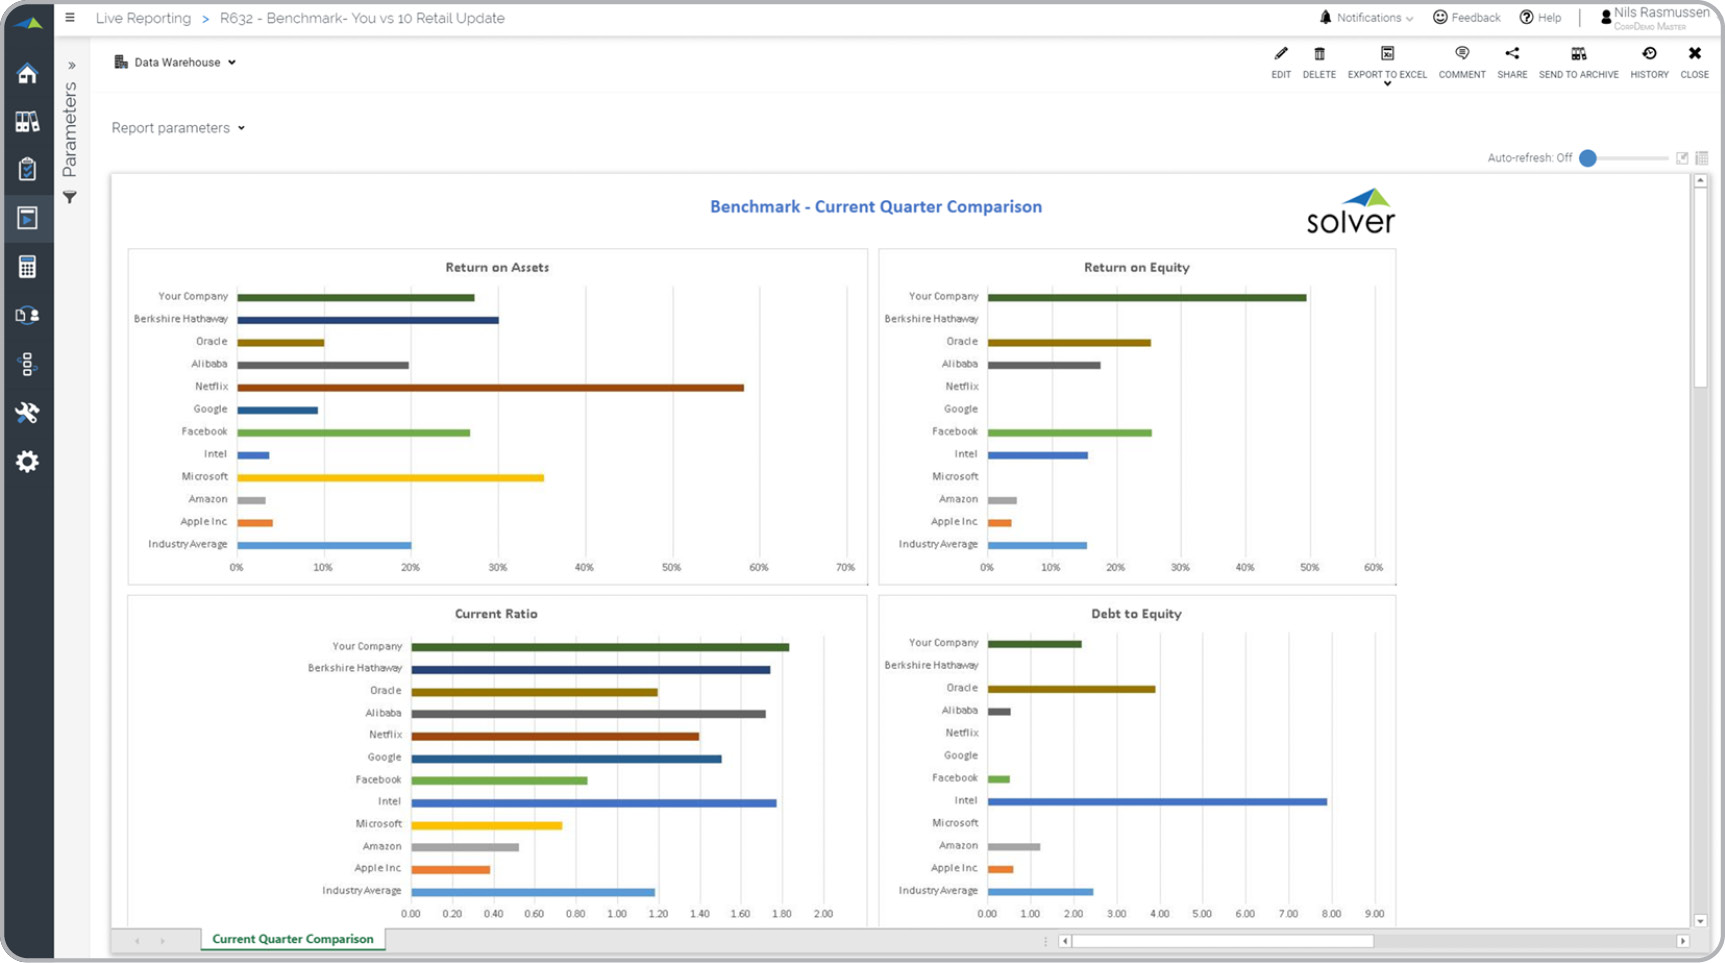
What is a Competitor Benchmark Analysis Report? Competitor benchmark reports are considered comparative analysis tools and are often used by CFOs, executives and analysts to measure internal company performance versus that of other companies. Some of the key functionality in this type of KPI benchmark report is that it is based on available data from competitors. Often, this is data from a web-site like Yahoo Finance or a government web-site like Edgar. The example consists of eight charts, each one displaying the trend for a specific metric for the past eight quarters. The metrics include Current Ratio, Return on Assets, Return on Equity, Profit Margin, Gross Margin, Debt to Equity, Revenue and Revenue Growth. Each chart shows data for your own company as well as the other companies selected when the report was executed.. You find an example of this type of KPI benchmark report below.
Purpose of Competitor Benchmarking Reports Companies and organizations use Competitor Benchmarking Reports to supplement internal variance analysis with external comparisons to ensure that the business also measured against the performance of specific external companies. When used as part of good business practices in a Financial Planning & Analysis (FP&A) and Executive department, a company can improve its strategies as well as reduce the chances that it falls behind other companies in the industry.
Who Uses This Type of KPI benchmark report? The typical users of this type of KPI benchmark report are: CFOs, executives, board members, and analysts. Other KPI benchmark reports Often Used in Conjunction with Competitor Benchmarking Reports Progressive Financial Planning & Analysis (FP&A) and Executive Departments sometimes use several different Competitor Benchmarking Reports, along with benchmarking dashboards, comparative variance reports, KPI reports, strategy summaries and other management and control tools.
Where Does the Data for Analysis Originate From? The Actual (historical transactions) data typically comes from data services and manual entry from web-sites like Yahoo Finance and Edgar, as well as internal data from enterprise resource planning (ERP) systems like: Microsoft Dynamics 365 (D365) Finance, Microsoft Dynamics 365 Business Central (D365 BC), Microsoft Dynamics AX, Microsoft Dynamics NAV, Microsoft Dynamics GP, Microsoft Dynamics SL, Sage Intacct, Sage 100, Sage 300, Sage 500, Sage X3, SAP Business One, SAP ByDesign, Acumatica, Netsuite and others. In analyses where budgets or forecasts are used, the planning data most often originates from in-house Excel spreadsheet models or from professional xFP&A solutions.
This Solver report template connects directly to your ERP data via the Solver Data Warehouse, enabling near real-time analysis with minimal setup. Designed for QuickStart deployment, it can be activated rapidly so your team can focus on analysis and decisions — not data preparation.
What is the Benchmark Comparison Report in Solver? The Benchmark Comparison Report is a pre-built xFP&A report template in Solver that delivers key financial and operational metrics in a single, easy-to-use interface, eliminating the need for manual data work or custom report development.
Who uses this Solver report template? This template is primarily used by CFOs, FP&A managers, and controllers who need accurate, timely reporting without manual data preparation. It is also valuable for department heads and business unit leaders who need periodic performance summaries.
Where does the data come from? Data is sourced automatically from your ERP system through the Solver Data Warehouse, which integrates with platforms such as Microsoft Dynamics 365 Business Central, Dynamics 365 Finance, Acumatica, Sage Intacct, and other leading ERP solutions. Once connected, the template updates in near real-time with no manual data entry required.
To learn more, visit the Resource Library.