
Bank – Securities Summary Portfolio – Trended
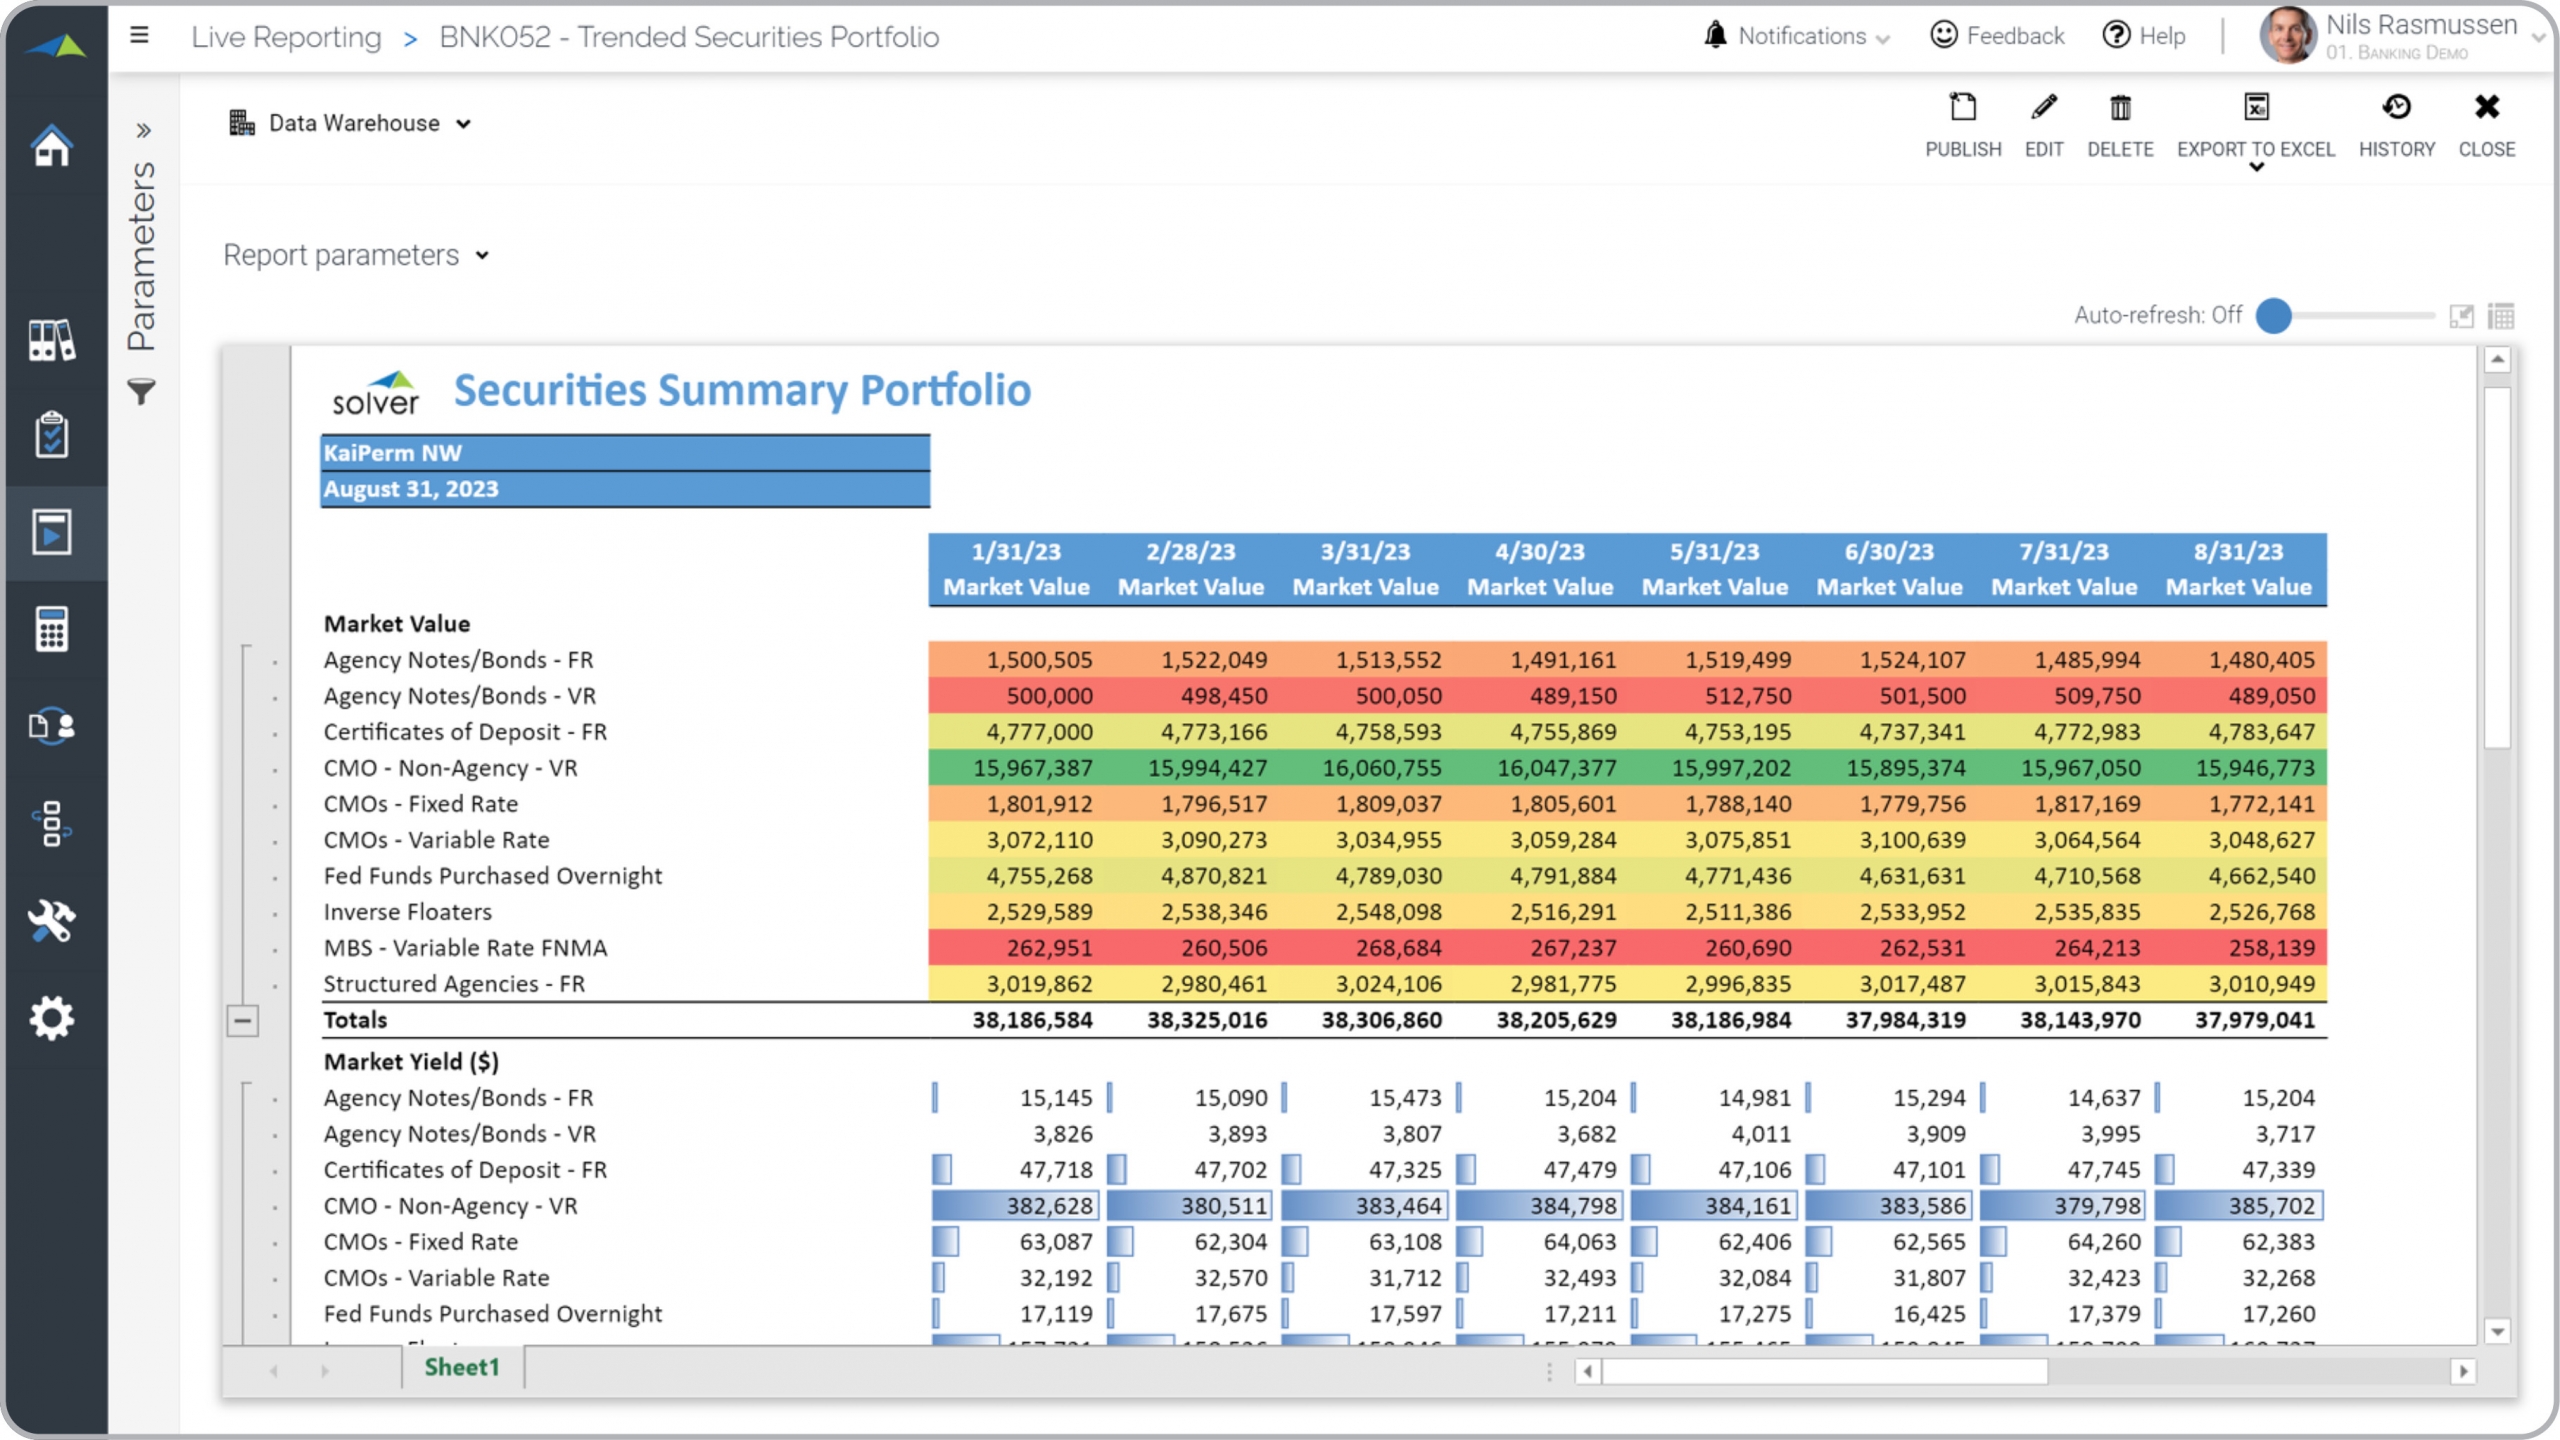
What is a Trended Securities Summary Report for Banks? Trended Securities Summary Reports are considered monthly trend analysis tools and are used by investment managers and analysts to monitor monthly trends in their portfolio. Some of the main functionality in this type of monthly trend report is that it dynamically lists months up to the current period across the columns with market yield in percent and amount figures down the rows. The top section (not visible in the screenshot below) shows the current market value of each security type. Color coding at the cell level helps the user quickly see high and low performing months and securities. You find an example of this type of monthly trend report below.
Purpose of Trended Securities Portfolio Reports Banks use Trended Securities Portfolio Reports to easily discover trends and compare security values and yields. When used as part of good business practices in Investment- and Finance Departments, a bank can improve its securities strategies and profitability, and it can reduce the chances that important trends and outliers are discovered later than necessary.
Who Uses This Type of Monthly Trend Report? The typical users of this type of monthly trend report are: Investment managers, securities portfolio managers, analysts. Other Reports Often Used in Conjunction with Trended Securities Portfolio Reports Progressive Investment- and Finance departments sometimes use several different Securities Portfolio Reports, along with securities transaction reports, investment dashboards, KPI dashboards, securities dashboards and other management and control tools.
Where Does the Data for Analysis Originate From? The Actual (historical transactions) data typically comes from securities management software and enterprise resource planning (ERP) systems like: Microsoft Dynamics 365 (D365) Finance, Microsoft Dynamics 365 Business Central (D365 BC), Microsoft Dynamics AX, Microsoft Dynamics NAV, Microsoft Dynamics GP, Microsoft Dynamics SL, Sage Intacct, Sage 100, Sage 300, Sage 500, Sage X3, SAP Business One, SAP ByDesign, Acumatica, Netsuite and others. In analyses where budgets or forecasts are used, the planning data most often originates from in-house Excel spreadsheet models or from professional xFP&A solutions.
Built for banking finance teams and aligned with Solver's xFP&A platform, this Solver report template connects directly to your ERP data via the Solver Data Warehouse, enabling near real-time analysis with minimal setup. Designed for QuickStart deployment, it can be activated rapidly so your team can focus on analysis and decisions — not data preparation.
What is the Bank – Securities Summary Portfolio – Trended in Solver? The Bank – Securities Summary Portfolio – Trended is a pre-built xFP&A report template in Solver designed for banking organizations. It delivers key financial and operational metrics in a single, easy-to-use interface — purpose-built for banking finance workflows.
Who uses this Solver report template? Finance leaders at banking organizations — including CFOs, finance managers, and bank executives — use this template to get fast, reliable answers without waiting on IT or building custom reports. It supports both day-to-day monitoring and strategic decision-making.
Where does the data come from? Data is sourced automatically from your ERP system through the Solver Data Warehouse, which integrates with platforms such as Microsoft Dynamics 365 Business Central, Dynamics 365 Finance, Acumatica, Sage Intacct, and other leading ERP solutions. Core banking systems and loan management platforms are also supported as data sources. Once connected, the template updates in near real-time with no manual data entry required.
To learn more, visit the Resource Library.