
Bank – Profit (loss) and KPIs - New Customer Acquisition
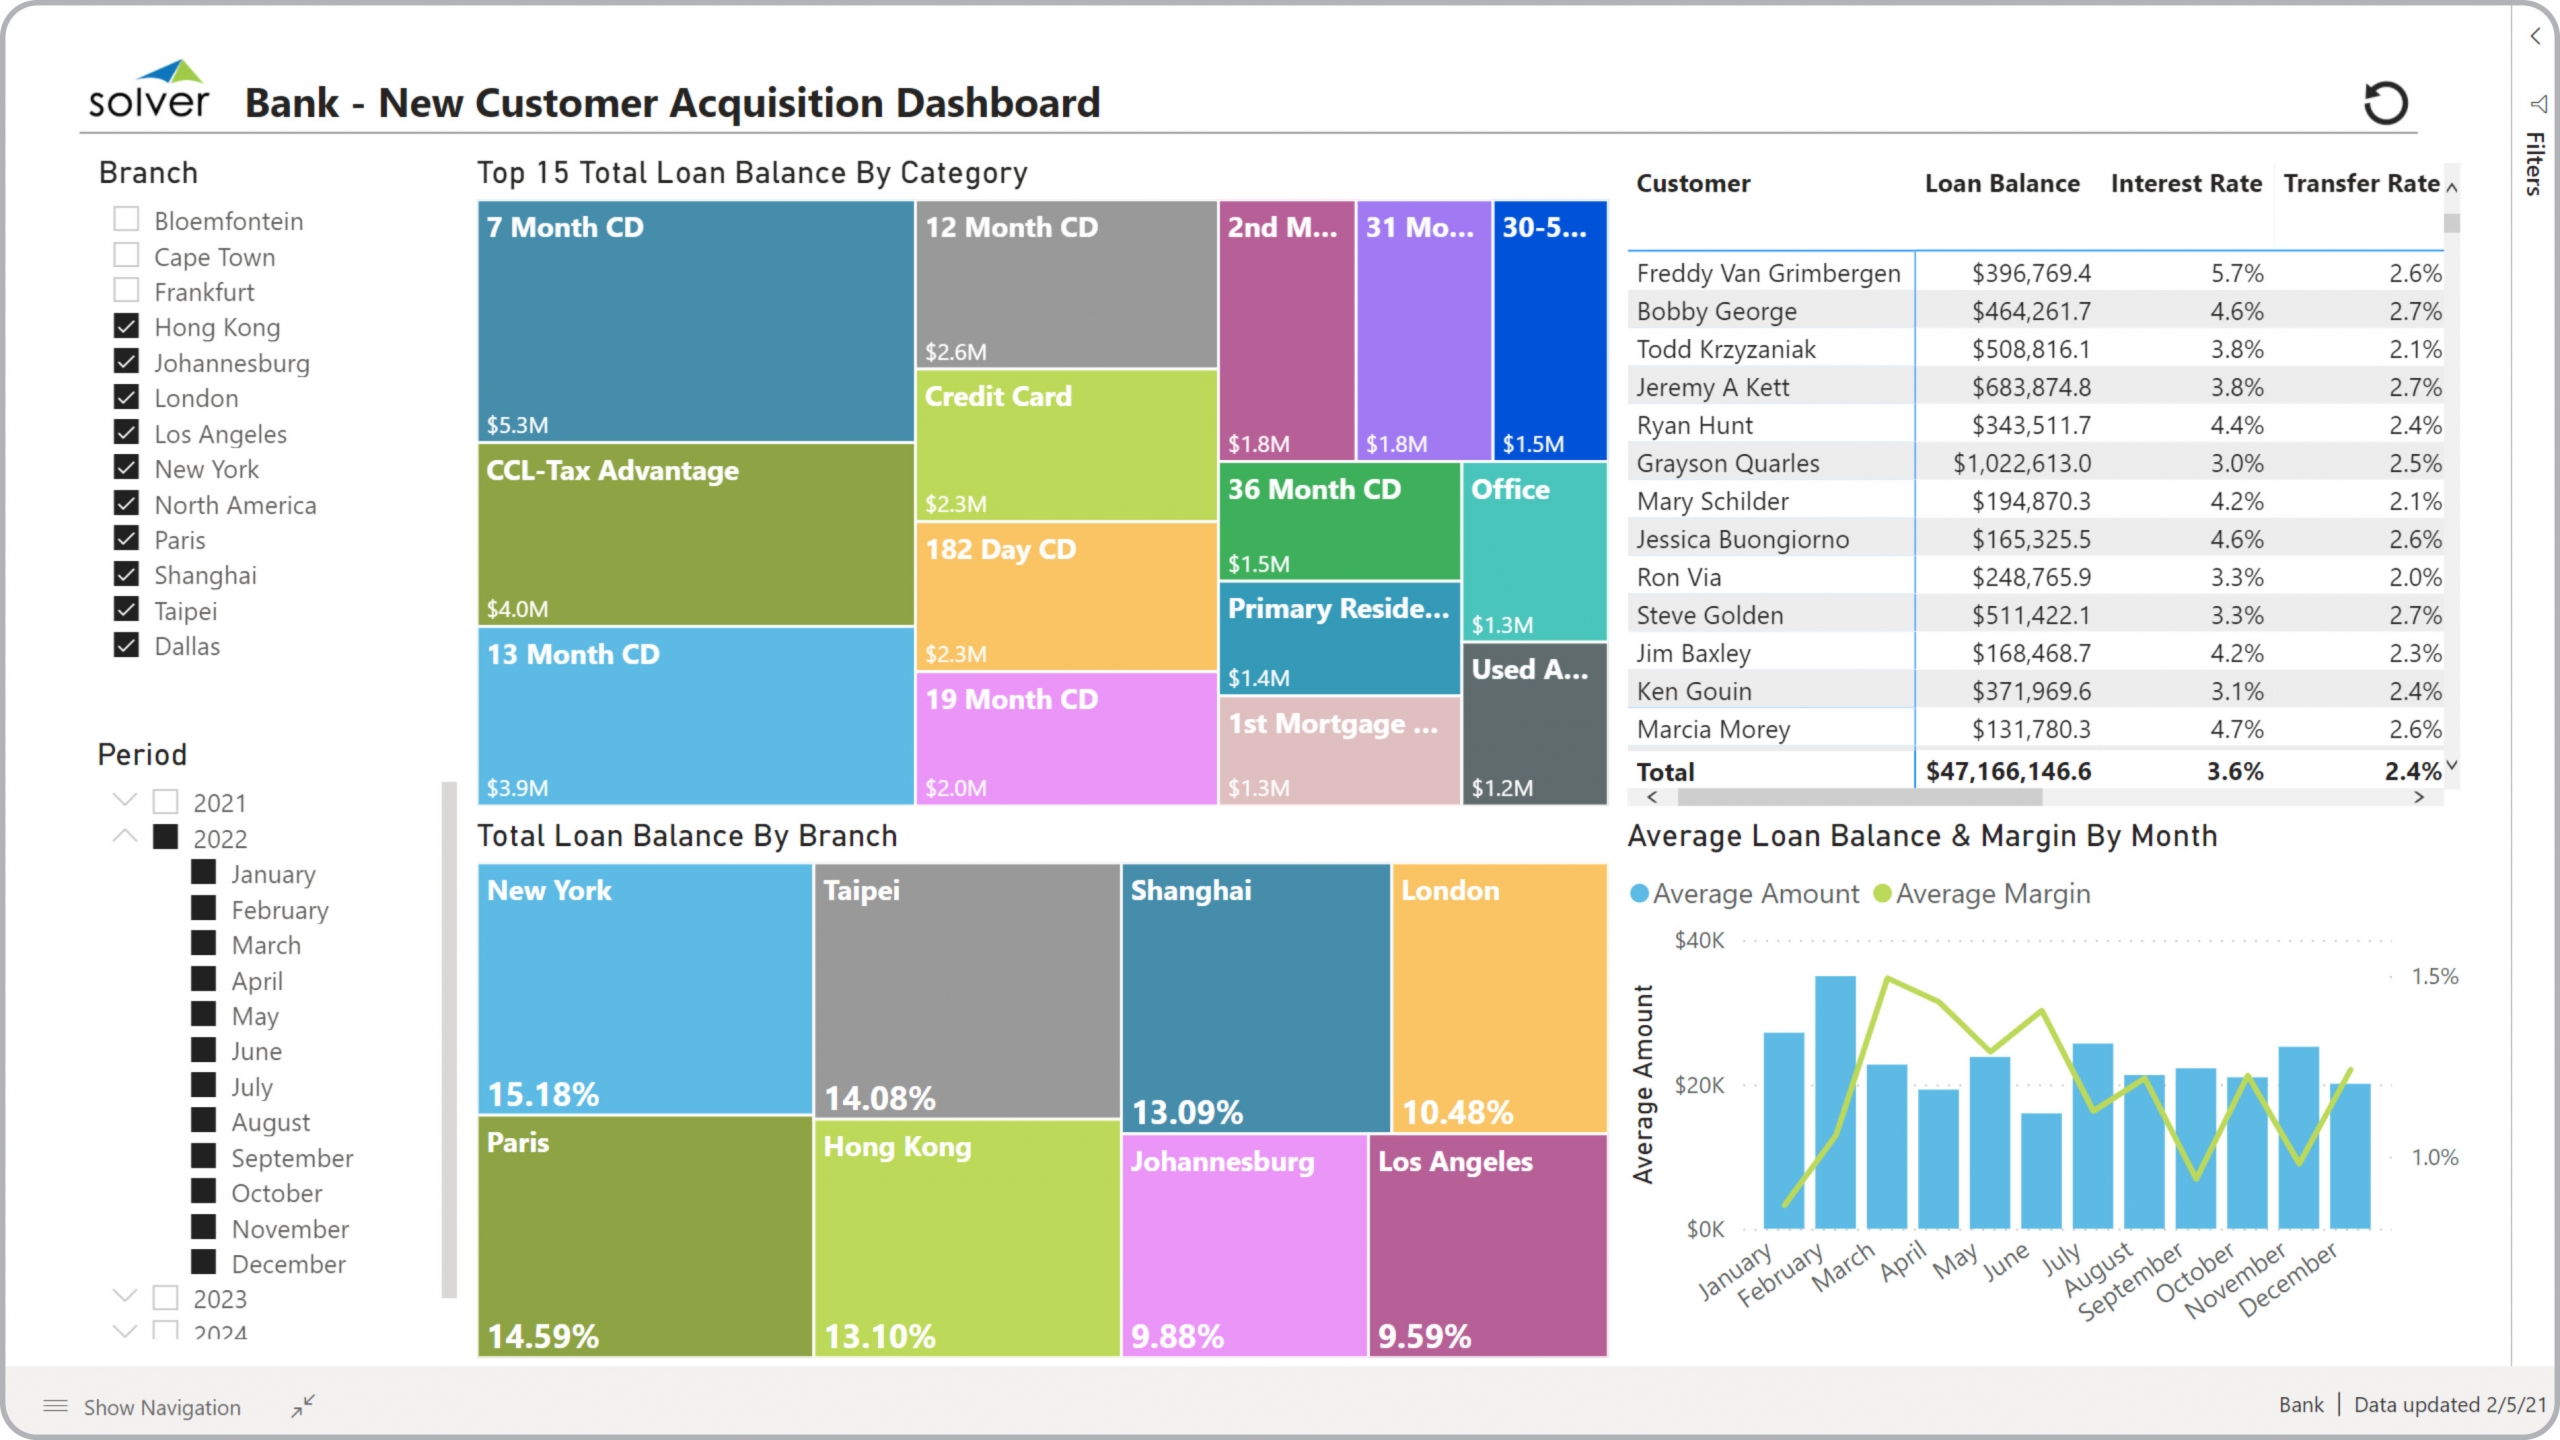
What is a Customer Acquisition Dashboard? Customer Acquisition Dashboards are considered customer analysis tools and are used by executives, marketing and product managers to analyze metrics and trends related to new customers. Some of the main functionality in this type of dashboard is that it provides easy insight into customer behavior from four different perspectives, including: 1) Top loan balances by category, 2) Total loan balance by bank branch, 3) Table with customer metrics as well as totals: Loan balance, interest rate, transfer rate, net interest margin, interest amount, and 4) Monthly trend with loan balance and margin. The dashboard is interactive so, as an example, if the user clicks on a specific customer the entire dashboard filters down to only show data for that selection. You find an example of this type of dashboard below.
Purpose of Customer Acquisition Dashboards Banks use Customer Acquisition Dashboards to enable managers to quickly get a picture of customer product preferences and related financial impact. When used as part of good business practices in Sales/Customer Acquisition and Financial Planning & Analysis (FP&A) departments, a company can improve its customer- and marketing strategies and increase related revenues, and it can reduce the chances that sales and product managers sub-optimize their offerings and marketing decisions.
Who Uses This Type of Dashboard? The typical users of this type of dashboard are: Executives, marketing managers, product managers, sales managers. Other Reports Often Used in Conjunction with Customer Acquisition Dashboards Progressive Sales/customer Acquisition and Financial Planning & Analysis (FP&A) departments sometimes use several different Customer Acquisition Dashboards, along with financial statements, product dashboards, loan dashboards, KPI reports, call reports, detailed customer reports and other management and control tools.
Where Does the Data for Analysis Originate From? The Actual (historical transactions) data typically comes from enterprise resource planning (ERP) systems like: Microsoft Dynamics 365 (D365) Finance, Microsoft Dynamics 365 Business Central (D365 BC), Microsoft Dynamics AX, Microsoft Dynamics NAV, Microsoft Dynamics GP, Microsoft Dynamics SL, Sage Intacct, Sage 100, Sage 300, Sage 500, Sage X3, SAP Business One, SAP ByDesign, Acumatica, Netsuite and others. In analyses where budgets or forecasts are used, the planning data most often originates from in-house Excel spreadsheet models or from professional xFP&A solutions.
Built for banking finance teams and aligned with Solver's xFP&A platform, this Solver report template connects directly to your ERP data via the Solver Data Warehouse, enabling near real-time analysis with minimal setup. Designed for QuickStart deployment, it can be activated rapidly so your team can focus on analysis and decisions — not data preparation.
What is the Bank – Profit (loss) and KPIs - New Customer Acquisition in Solver? The Bank – Profit (loss) and KPIs - New Customer Acquisition is a pre-built xFP&A report template in Solver designed for banking organizations. It delivers key financial and operational metrics in a single, easy-to-use interface — purpose-built for banking finance workflows.
Who uses this Solver report template? This template is primarily used by CFOs, finance managers, and bank executives in banking organizations who need accurate, timely data to support planning, reporting, and decision-making. It is particularly valuable for banking finance teams managing budgets, forecasts, and performance reviews.
Where does the data come from? Data is sourced automatically from your ERP system through the Solver Data Warehouse, which integrates with platforms such as Microsoft Dynamics 365 Business Central, Dynamics 365 Finance, Acumatica, Sage Intacct, and other leading ERP solutions. Core banking systems and loan management platforms are also supported as data sources. Once connected, the template updates in near real-time with no manual data entry required.
To learn more, visit the Resource Library.