
Balance Sheet Consolidating Report
Who uses Consolidating Balance Sheet Reports and What are Some Key Analytical Features? In today’s fast-paced business environment, Corporate Controllers are under high pressure to supply end users like executive teams with timely and concise Financial Statements. Companies use key features like the ones below to support their users with effective analysis that helps drive corporate headquarter decisions:
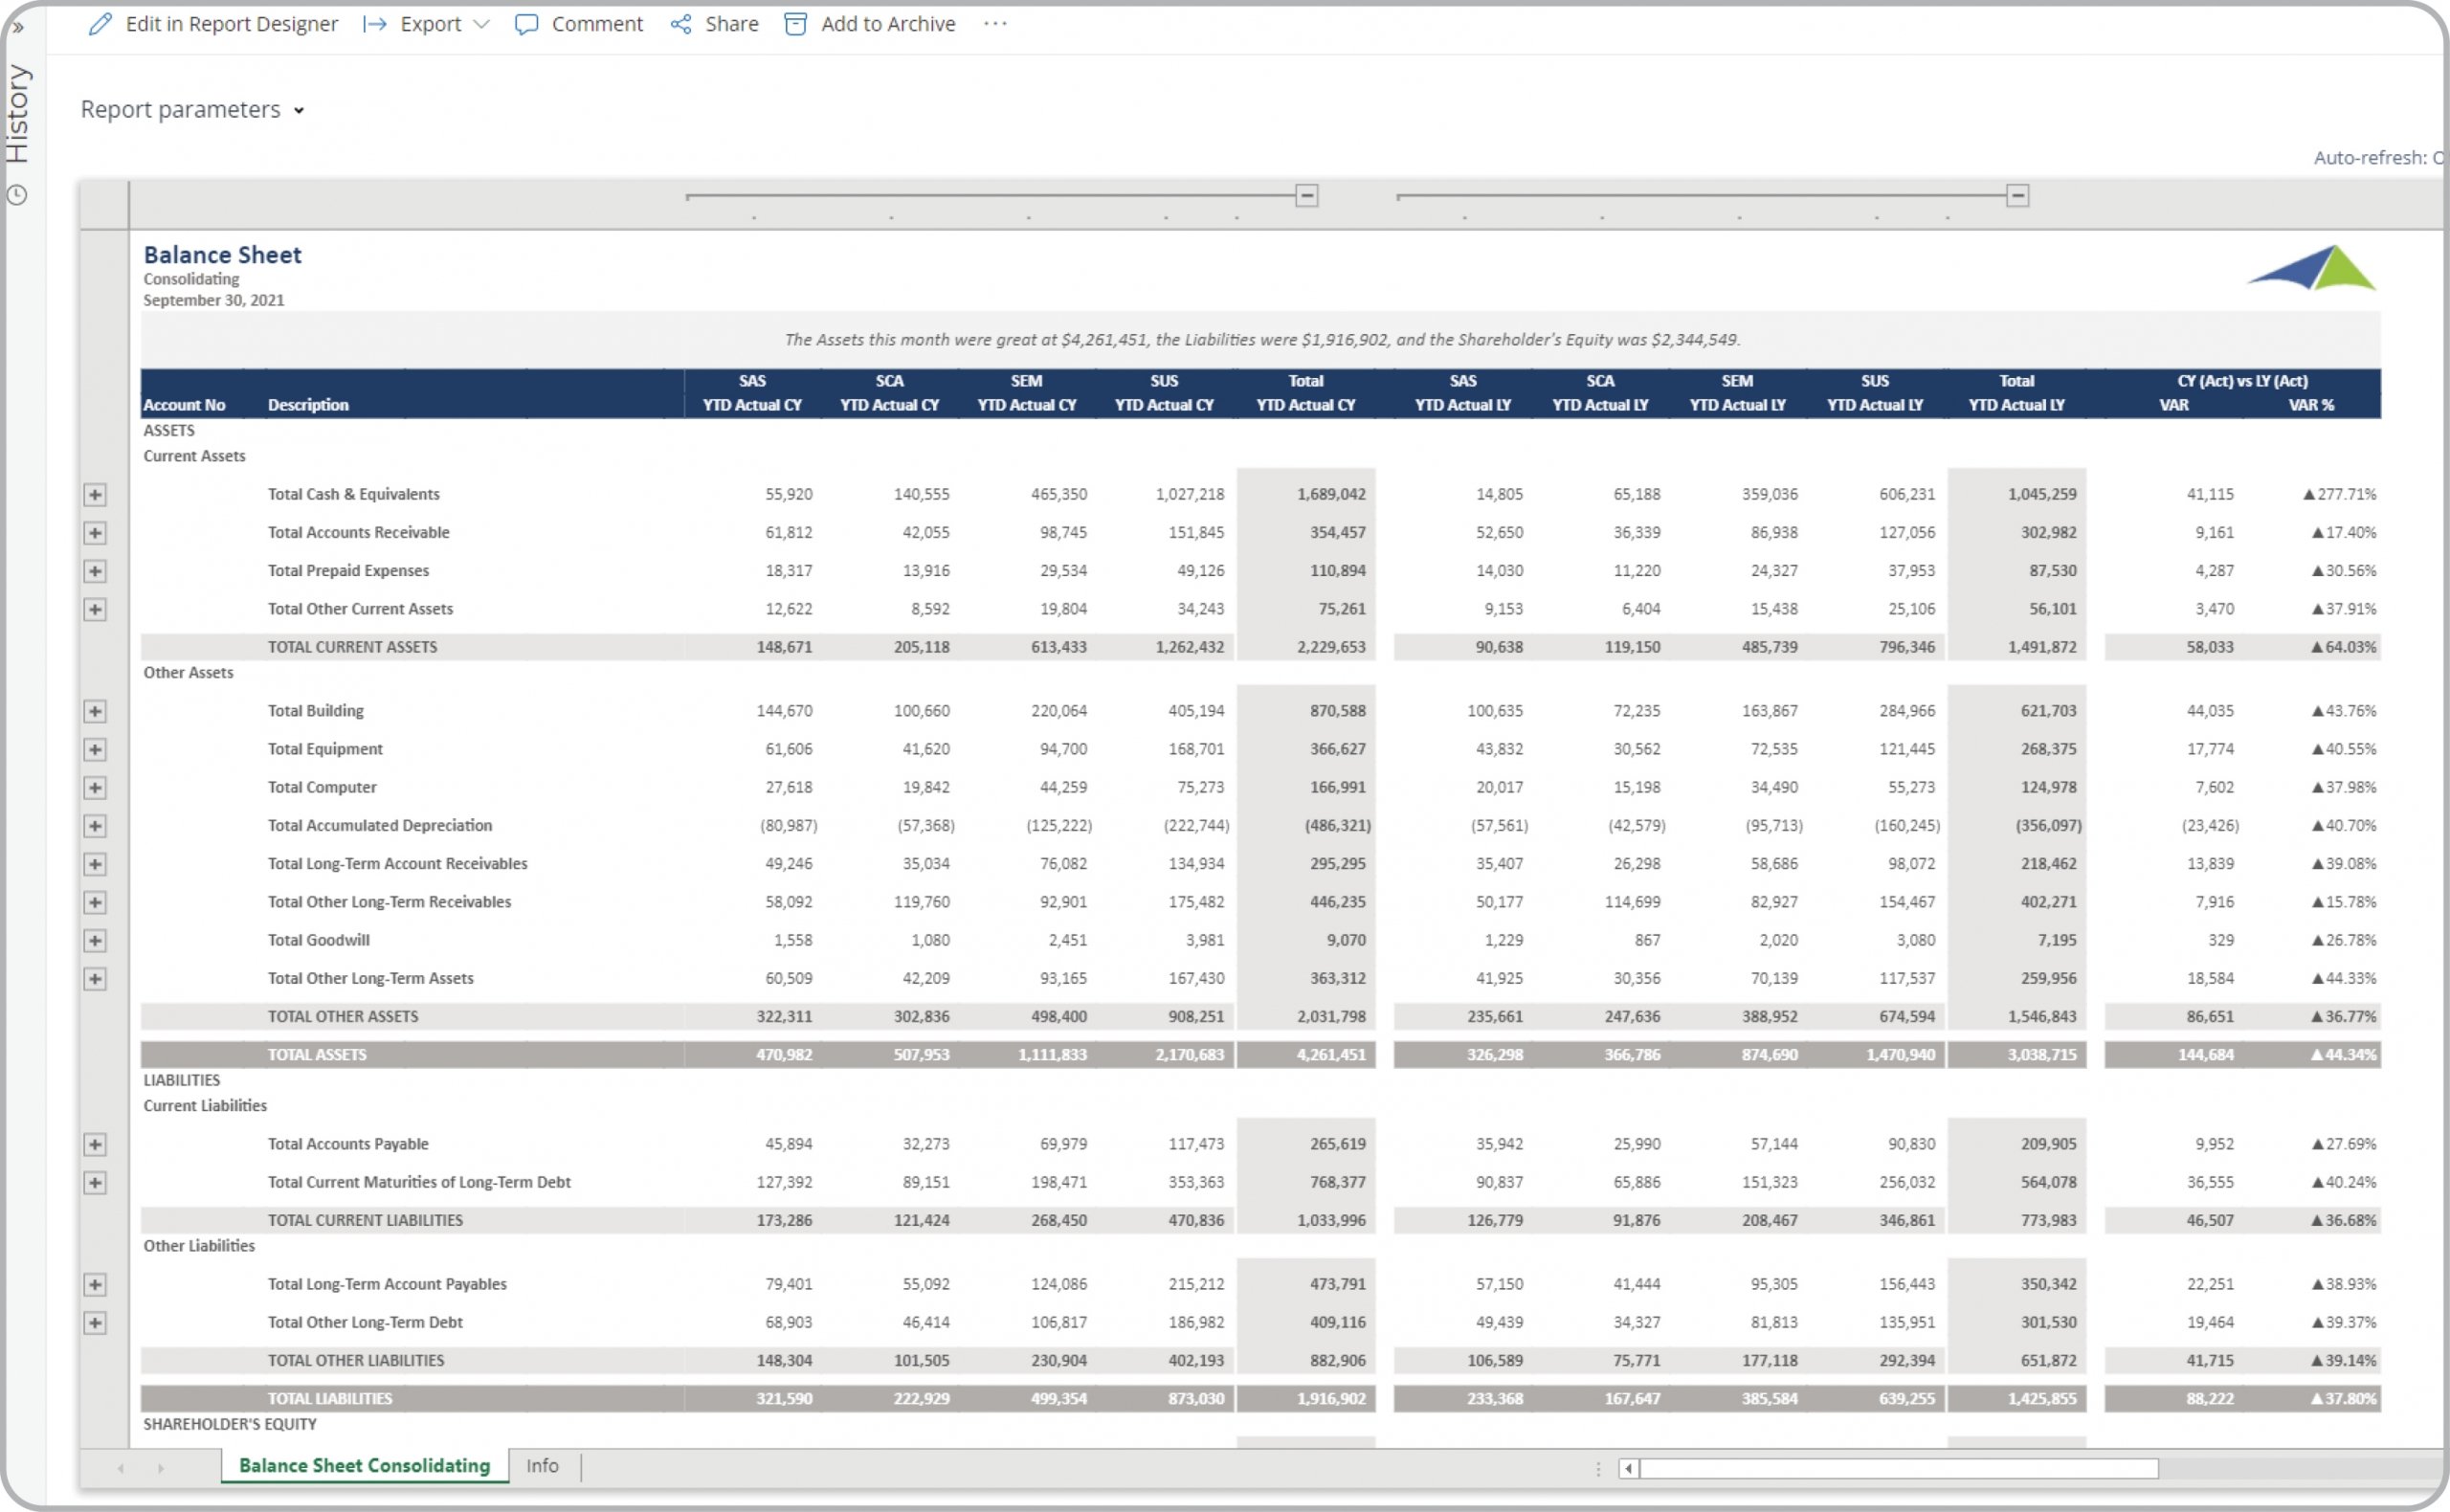
- Dynamic listing across columns of the selected subsidiaries
- Expandable rows by GL account category and account
- Variance analysis in amount and percent, and with indicators
Data Integration to Transaction Systems Most organizations these days want automated and streamlined planning, reporting and analysis. However, many of the benefits described earlier rely on best of breed extended financial planning and analysis (xFP&A) tools and/or Business Intelligence (BI) capabilities as well as data marts or data warehouses that use pre-built integrations to the organization’s ERP system. Oftentimes, they also need integrations to other key data sources like CRM, subscription systems, payroll tools, etc. Modern, cloud-based ERPs like Microsoft Dynamics 365 Finance (D365 Finance), Microsoft Dynamics 365 Business Central (D365 BC), Sage Intacct, Acumatica, Netsuite and SAP have robust APIs which allow for dynamic integrations to xFP&A and BI tools that are fully automated and flexible to run on a schedule or on-demand.
This Solver report template connects directly to your ERP data via the Solver Data Warehouse, enabling near real-time analysis with minimal setup. Designed for QuickStart deployment, it can be activated rapidly so your team can focus on analysis and decisions — not data preparation.
What is the Balance Sheet Consolidating Report in Solver? The Balance Sheet Consolidating Report is a pre-built xFP&A report template in Solver that delivers key financial and operational metrics in a single, easy-to-use interface, eliminating the need for manual data work or custom report development.
Who uses this Solver report template? This template is primarily used by CFOs, FP&A managers, and controllers who need accurate, timely reporting without manual data preparation. It is also valuable for department heads and business unit leaders who need periodic performance summaries.
Where does the data come from? Data is sourced automatically from your ERP system through the Solver Data Warehouse, which integrates with platforms such as Microsoft Dynamics 365 Business Central, Dynamics 365 Finance, Acumatica, Sage Intacct, and other leading ERP solutions. Once connected, the template updates in near real-time with no manual data entry required.