

View Favorites
Hospitality – Casino Analysis
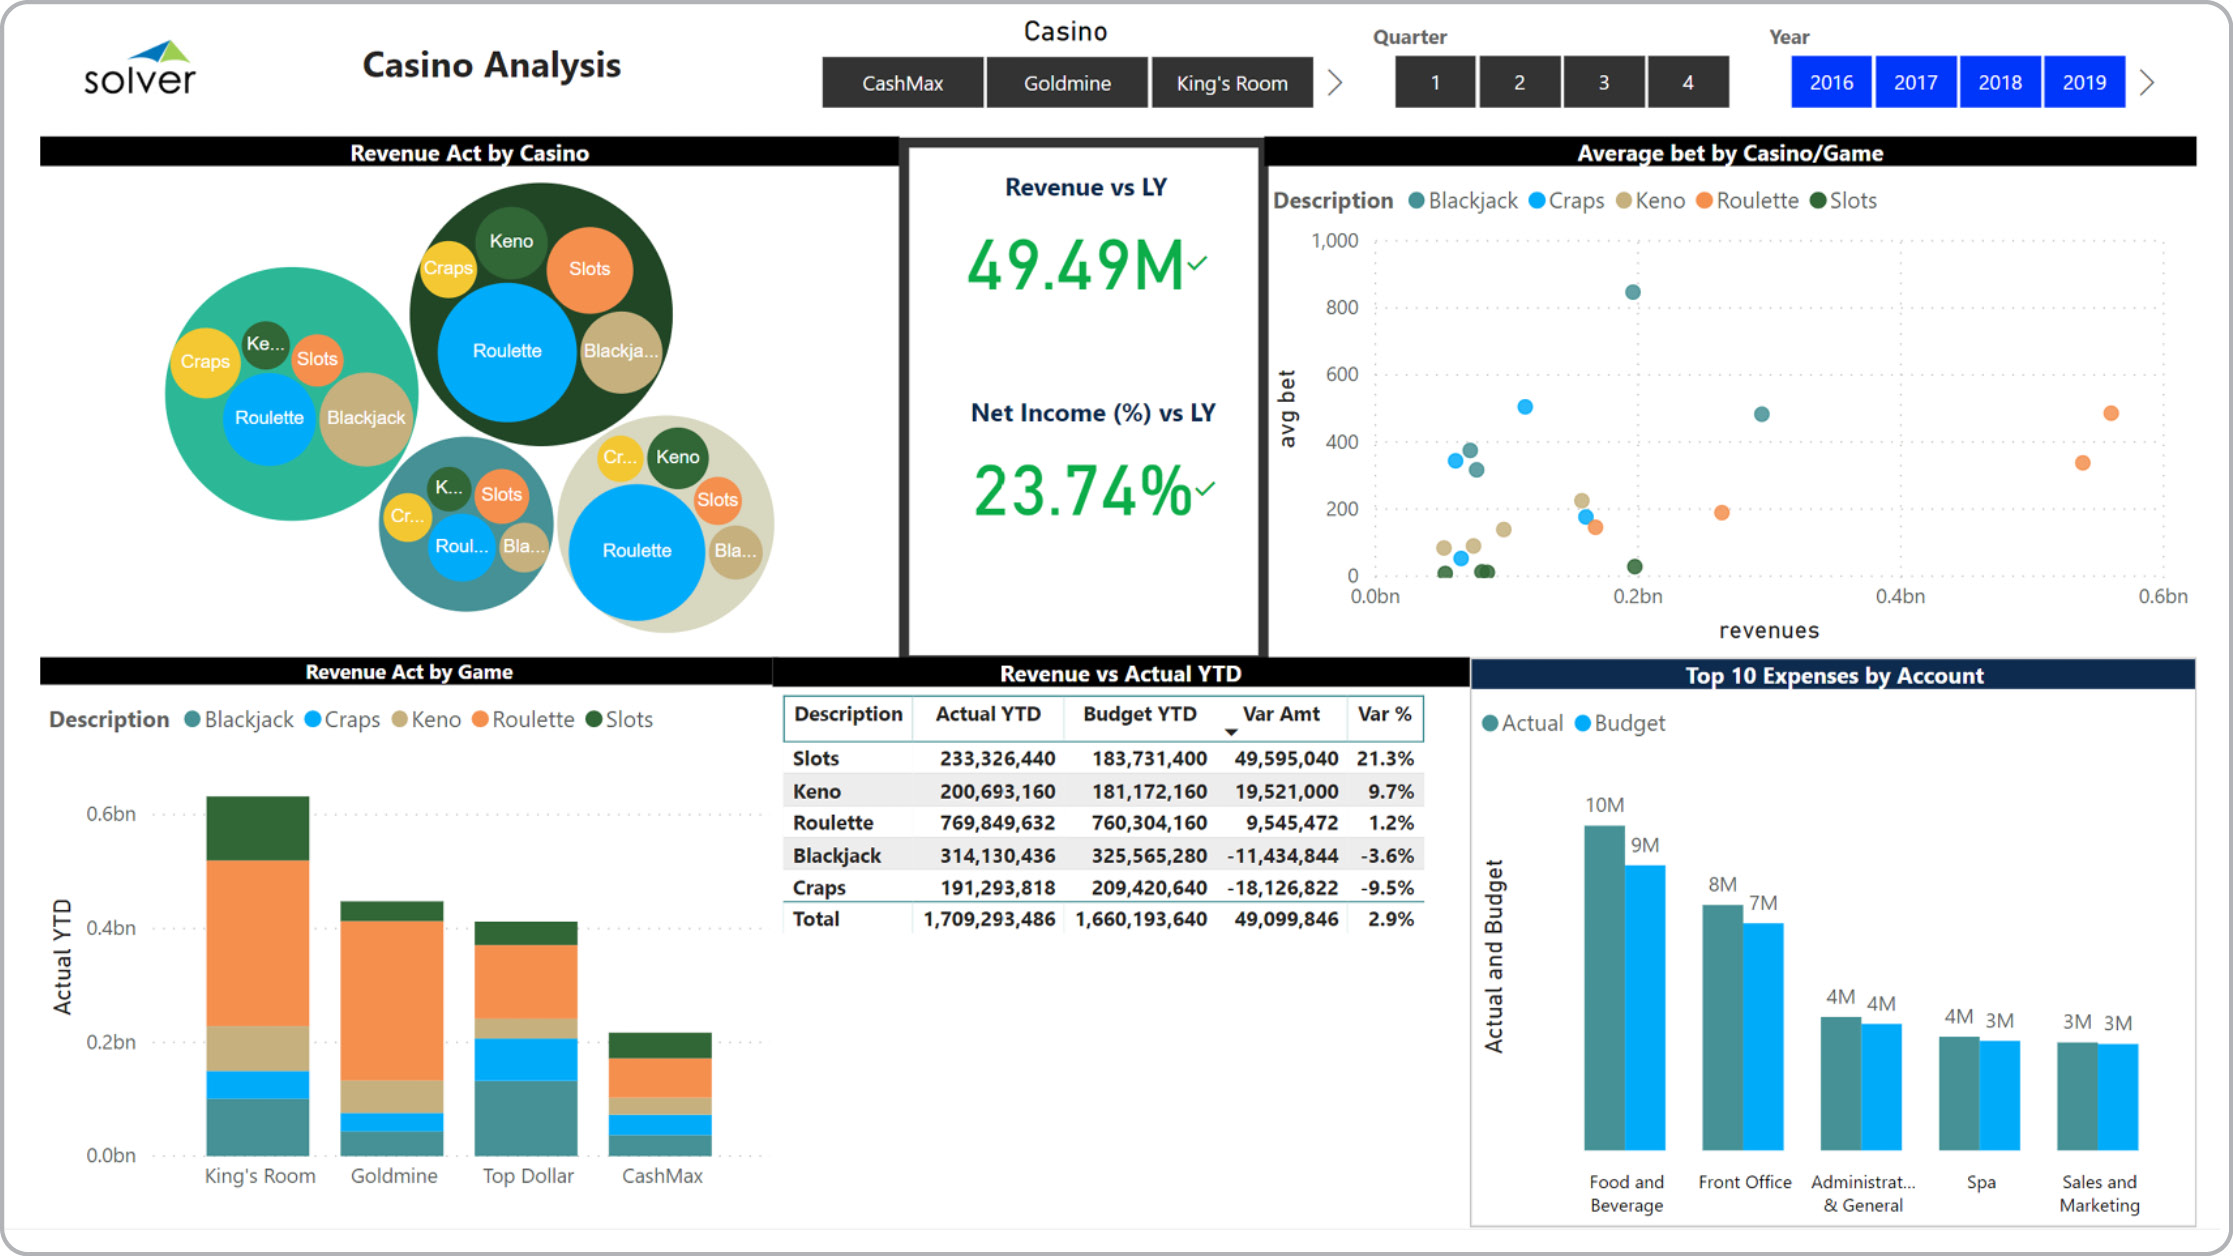
Power BI dashboard showing casino game and casino analysis.
What is a Casino Dashboard for Hospitality Companies? Casino Dashboards are considered gaming analysis tools and are used by executives and finance managers analyze casino and game financials. Some of the main functionality in this type of dashboard is that it includes graphical analysis from six perspectives: 1) Revenue by casino, 2) Revenue and Net Income KPIs versus last year, 3) Average bet by game, 4) Revenue by game, 5) Actual versus budget revenues with variances, and 6) Top 10 expenses by account/department. The filters on the top of the dashboard can be used to drill into detail for specific casinos and periods. You find an example of this type of dashboard below.
Purpose of Casino and Gaming Dashboards Hospitality organizations use Casino and Gaming Dashboards to provide casino and hospitality executives with an easy way to monitor essential financial performance metrics. When used as part of good business practices in a Financial Planning & Analysis (FP&A) department, an organization can improve and speed up its casino operating strategies and increase revenues, and it can reduce the chances that low performing casinos or games are off their radar longer than necessary.
Who Uses This Type of Dashboard? The typical users of this type of dashboard are: Finance officers, analysts, casino managers, hospitality executives. Other Reports Often Used in Conjunction with Casino and Gaming Dashboards Progressive Financial Planning & Analysis (FP&A) departments sometimes use several different Casino and Gaming Dashboards, along with Revenue dashboards, profit & loss reports, cash flow reports, forecast models and other management and control tools.
Where Does the Data for Analysis Originate From? The Actual (historical transactions) data typically comes from specialized gaming software as well as enterprise resource planning (ERP) systems like: Microsoft Dynamics 365 (D365) Finance, Microsoft Dynamics 365 Business Central (D365 BC), Microsoft Dynamics AX, Microsoft Dynamics NAV, Microsoft Dynamics GP, Microsoft Dynamics SL, Sage Intacct, Sage 100, Sage 300, Sage 500, Sage X3, SAP Business One, SAP ByDesign, Acumatica, Netsuite and others. In analyses where budgets or forecasts are used, the planning data most often originates from in-house Excel spreadsheet models or from professional xFP&A solutions.
To learn more, visit the Resource Library.
View Favorites