
Retail – Weekly Sales Forecast
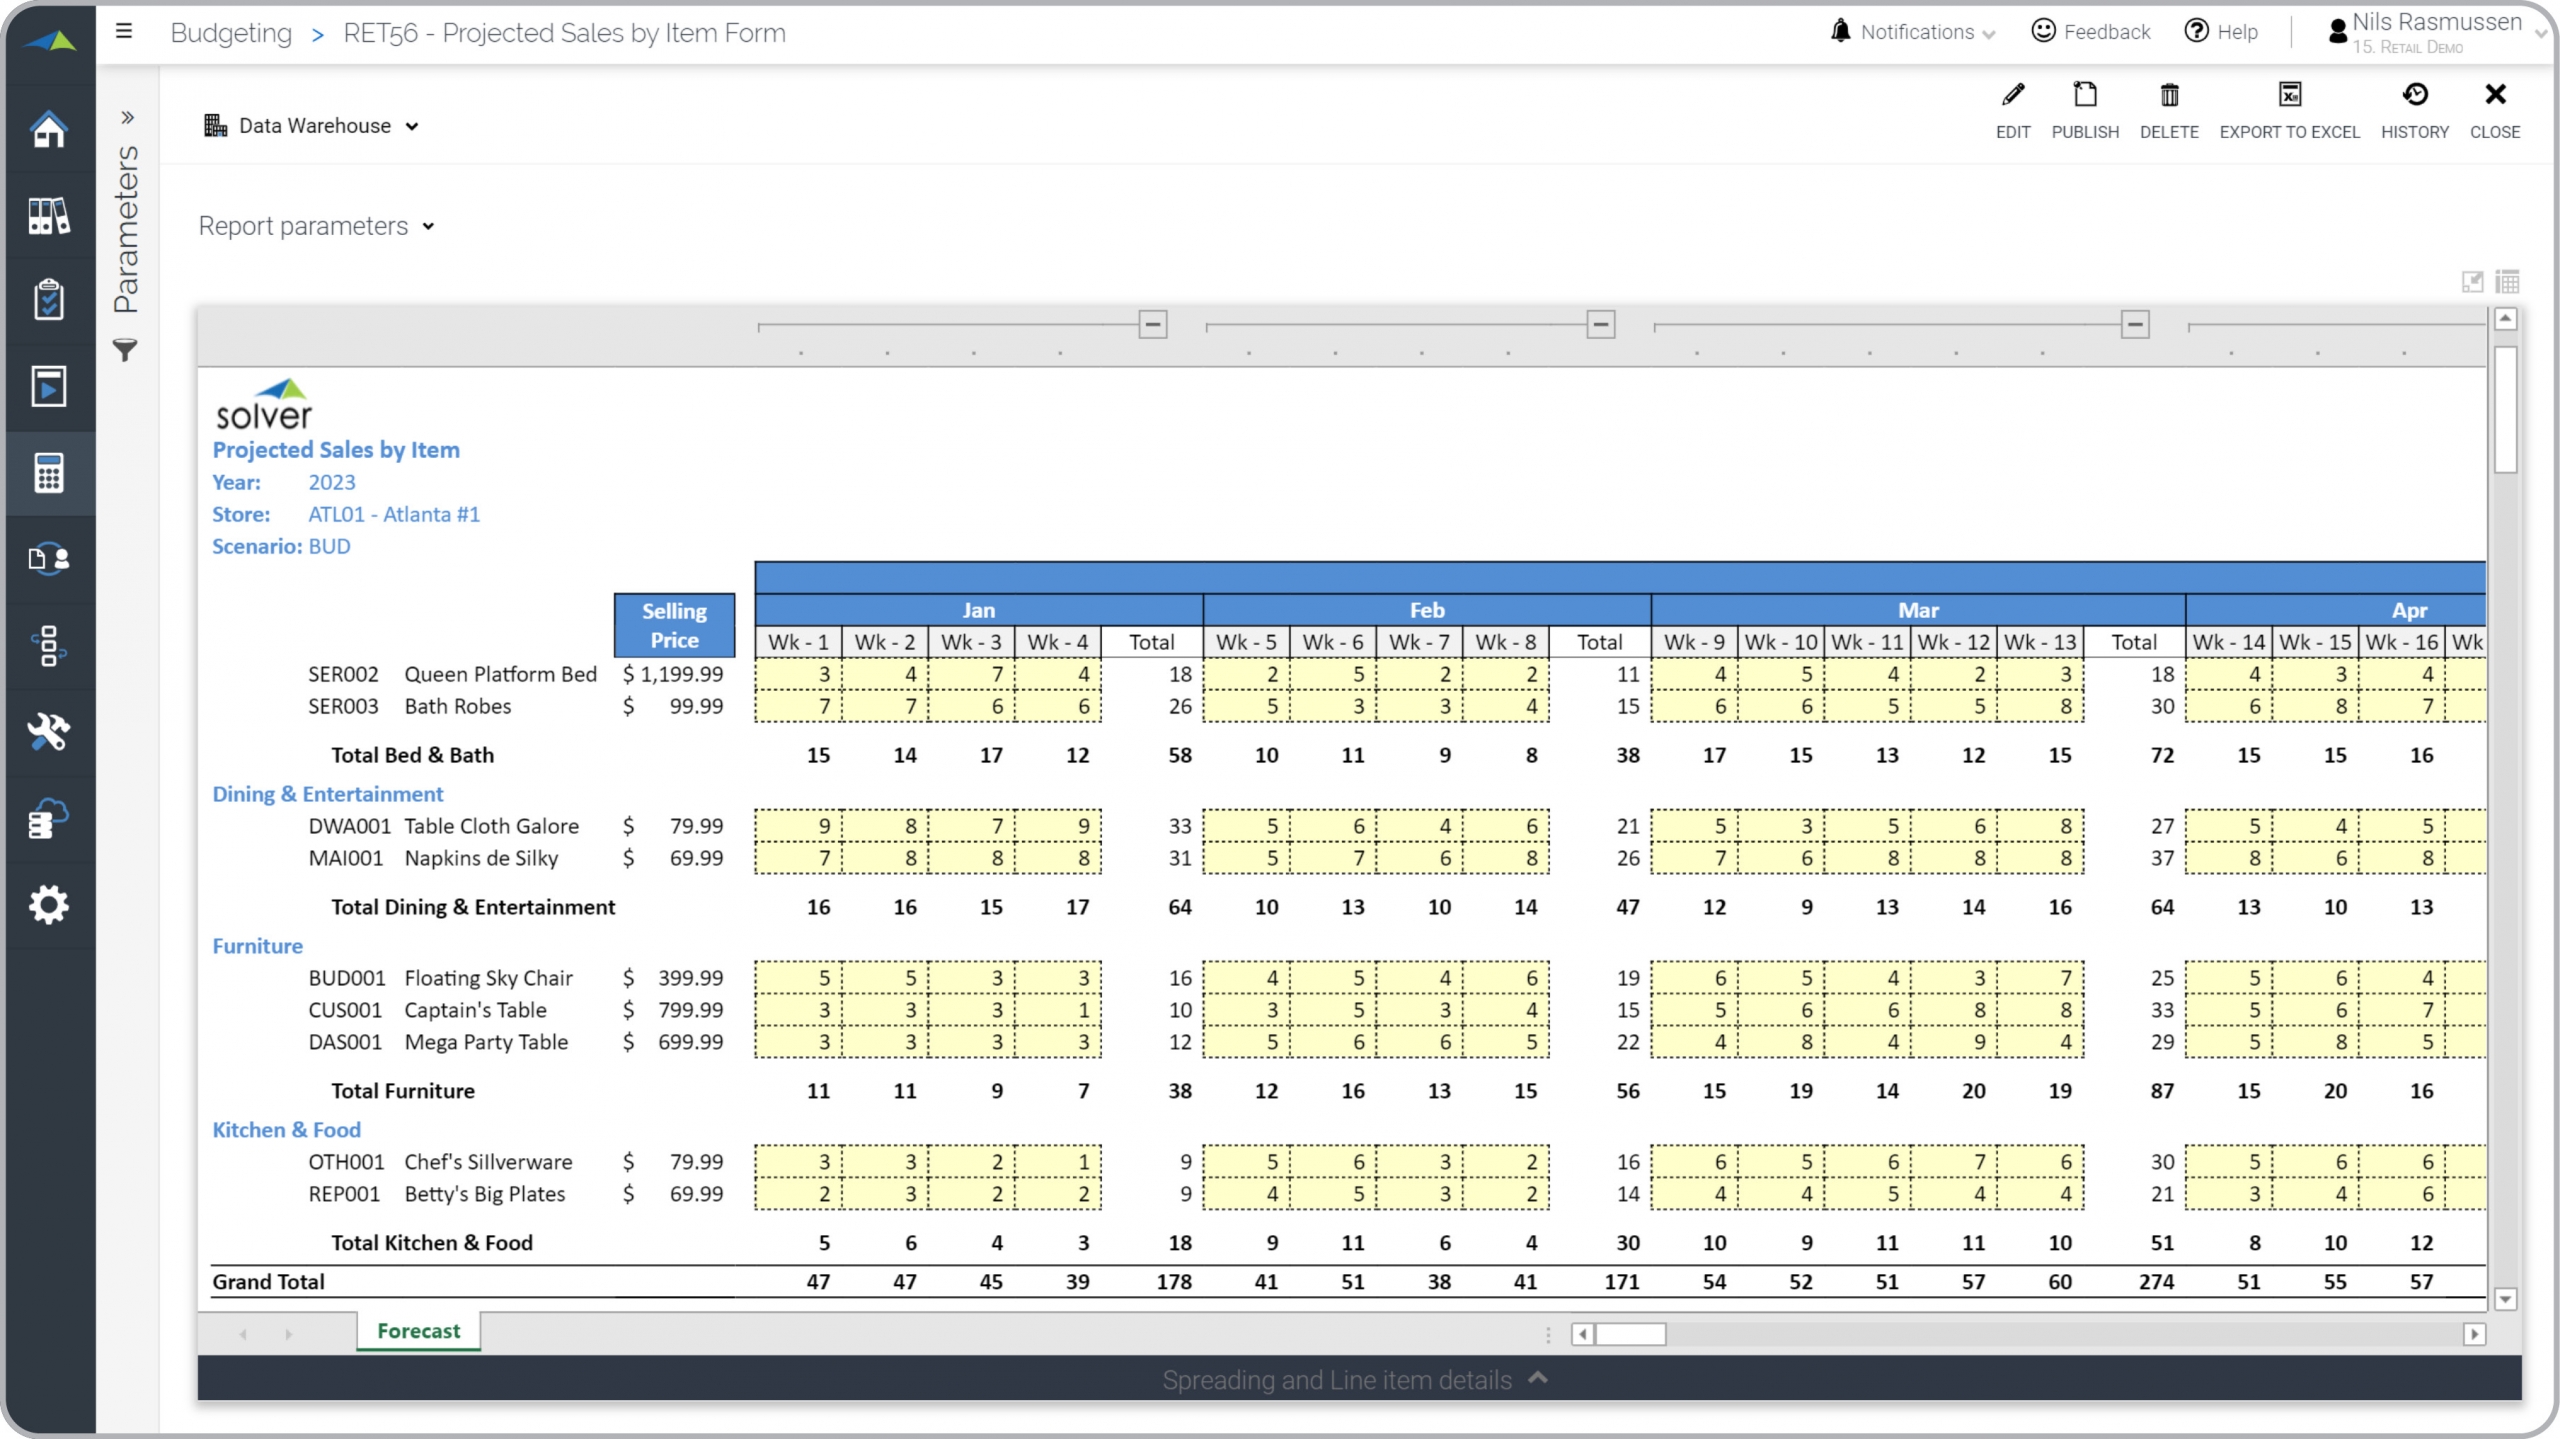
What is a Weekly Sales Budget? Detailed price and quantity sales estimates are considered a critical part of a retail company's budget and forecast processes, and are often used by regional sales executives and store managers to capture expected product sales in future weeks and months. Key functionality in this type of model automatically pulls up the item price and cost (entered in a different template) and then multiplies it with the quantity figures entered in the form seen below. This drives the expected sales amount per product, per store and in total for the company. As seen below, the input forms allows for 4-4-5 breakdown of weeks. You will find an example of this type of model below.
Purpose of Sales Planning by Week Retail companies use Sales Planning by Week to simplify the data capture of volume estimates from regional or store managers, and to get a detailed view of expected sales quantities and revenues by product. When used as part of good business practices in a Financial Planning & Analysis (FP&A) department, a company can improve its sales forecast accuracy which helps to budget for expenses and investments, as well as, reduce the chances that sales revenues become sub-optimized due to poor inventory planning.
Who Uses This Type of Model? The typical users of this type of model are: Budget managers, regional sales managers, product managers. Other Models Often Used in Conjunction with Sales Planning Progressive Financial Planning & Analysis (FP&A) Departments sometimes use several different Sales Planning templates, along with product price and cost budgets, capex, operating expenses, cash flow plans and other management and control tools.
Where Does the Data for Analysis Originate From? The Actual (historical transactions) data typically comes from enterprise resource planning (ERP) systems like: Microsoft Dynamics 365 (D365) Finance, Microsoft Dynamics 365 Business Central (D365 BC), Microsoft Dynamics AX, Microsoft Dynamics NAV, Microsoft Dynamics GP, Microsoft Dynamics SL, Sage Intacct, Sage 100, Sage 300, Sage 500, Sage X3, SAP Business One, SAP ByDesign, Acumatica, Netsuite and others. In analyses where budgets or forecasts are used, the planning data most often originates from in-house Excel spreadsheet models, professional xFP&A solutions, or other retail budgeting systems.
Built for retail finance teams and aligned with Solver's xFP&A platform, this Solver planning template connects directly to your ERP data via the Solver Data Warehouse, enabling near real-time analysis with minimal setup. Designed for QuickStart deployment, it can be activated rapidly so your team can focus on analysis and decisions — not data preparation.
What is the Retail – Weekly Sales Forecast in Solver? The Retail – Weekly Sales Forecast is a pre-built xFP&A planning template in Solver designed for retail organizations. It delivers key financial and operational metrics in a single, easy-to-use interface — purpose-built for retail finance workflows.
Who uses this Solver planning template? Cfos, fp&a managers, and retail finance teams in retail organizations rely on this Solver planning template to replace manual spreadsheet-based processes with automated, near real-time analysis. It is especially useful during month-end close, budget cycles, and board reporting.
Where does the data come from? Data is sourced automatically from your ERP system through the Solver Data Warehouse, which integrates with platforms such as Microsoft Dynamics 365 Business Central, Dynamics 365 Finance, Acumatica, Sage Intacct, and other leading ERP solutions. Once connected, the template updates in near real-time with no manual data entry required.
To learn more, visit the Resource Library.