

Trial Balance with Variance Analysis
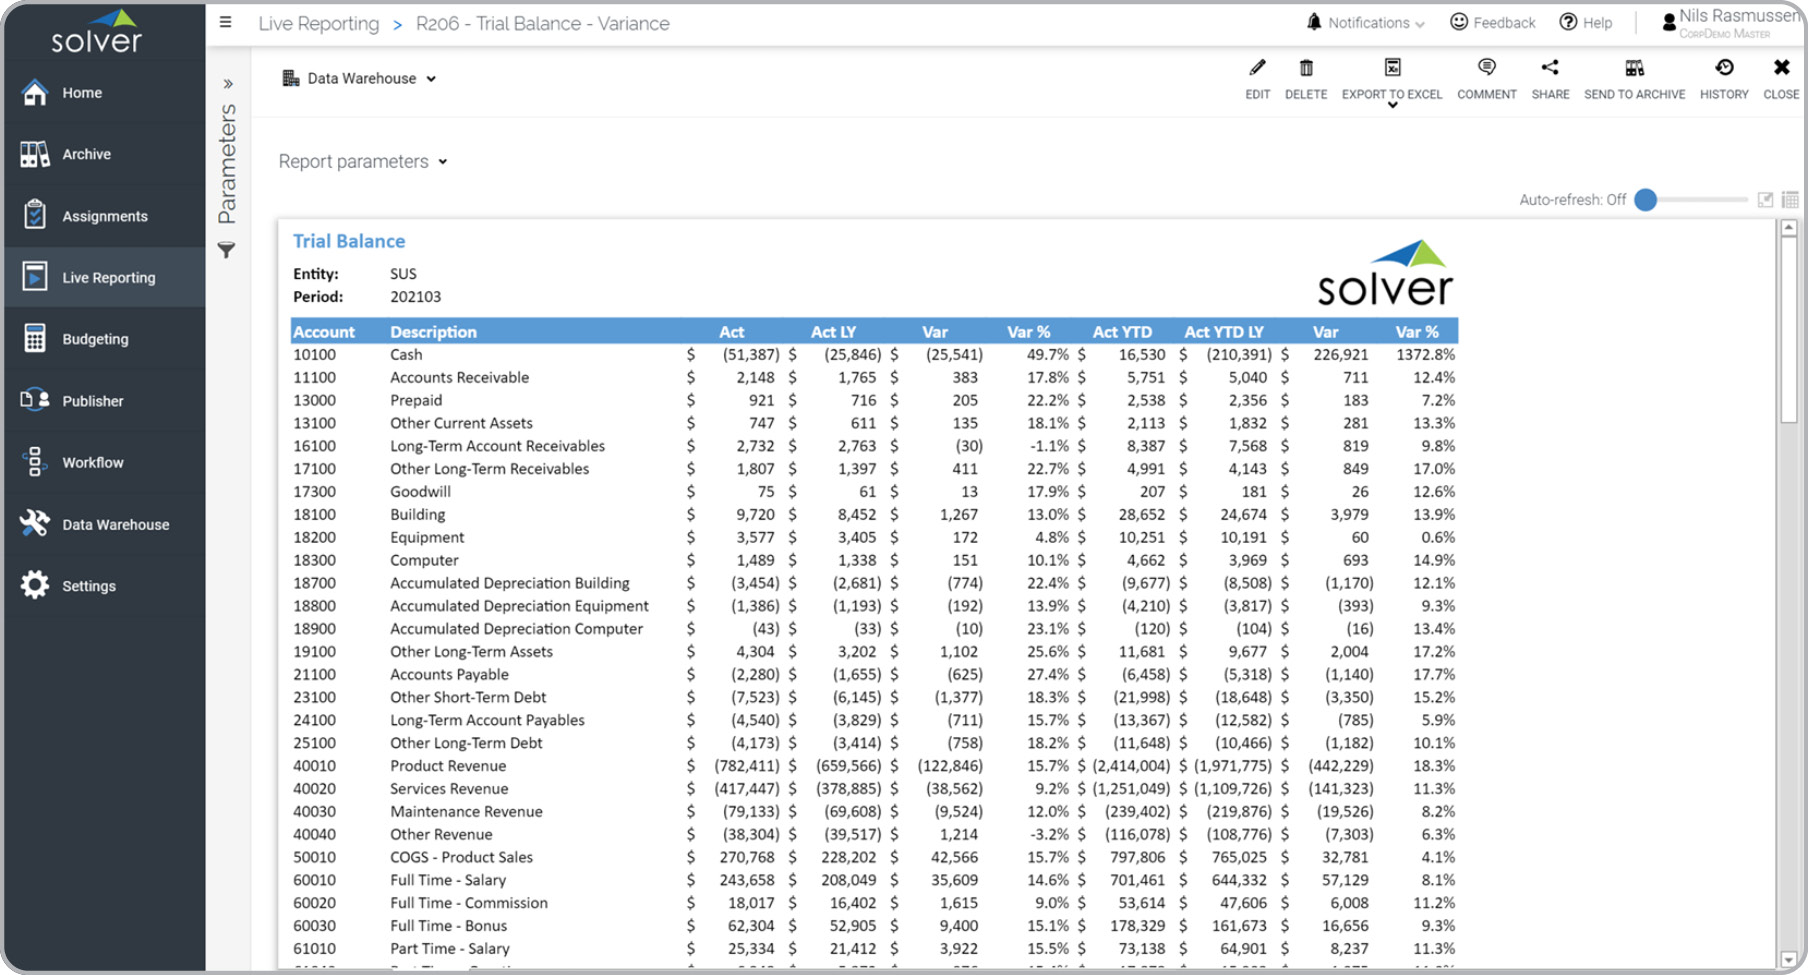
What is a Trial Balance Variance Report? Trial Balance Variance Reports are considered control reports and are often used by accountants to ensure that their General Ledger is in balance. A key functionality in this type of report not only displays the current month's account balances, but also provides a comparison to last year. This additional data along with percent (%) variance columns and a control total makes this report more useful than typical single month trial balance reports. You will find an example of this type of report below.
Purpose of Trial Balance Variance Reports Companies and organizations use Trial Balance Variance Reports to increase their capability to detect issues in their balances as compared to what single month trial balance reports provide. When used as part of good business practices in a Finance & Accounting Department, a company can improve its financial accuracy and control, as well as, reduce the chance that financial statements are wrong because of an issue with their general ledger entries.
Who Uses This Type of Report? The typical users of this type of report are: Accountants. Other Reports Often Used in Conjunction with Trial Balance Variance Reports Progressive Finance & Accounting Departments sometimes use several different Trial Balance Variance Reports, along with financial statements and other management and control tools.
Where Does the Data for Analysis Originate From? The Actual (historical transactions) data typically comes from enterprise resource planning (ERP) systems like: Microsoft Dynamics 365 (D365) Finance, Microsoft Dynamics 365 Business Central (D365 BC), Microsoft Dynamics AX, Microsoft Dynamics NAV, Microsoft Dynamics GP, Microsoft Dynamics SL, Sage Intacct, Sage 100, Sage 300, Sage 500, Sage X3, SAP Business One, SAP ByDesign, Acumatica, Netsuite and others. In analyses where budgets or forecasts are used, the planning data most often originates from in-house Excel spreadsheet models or from professional xFP&A solutions.
To learn more, visit the Resource Library.