
Nonprofit – Statement of Cash Flow
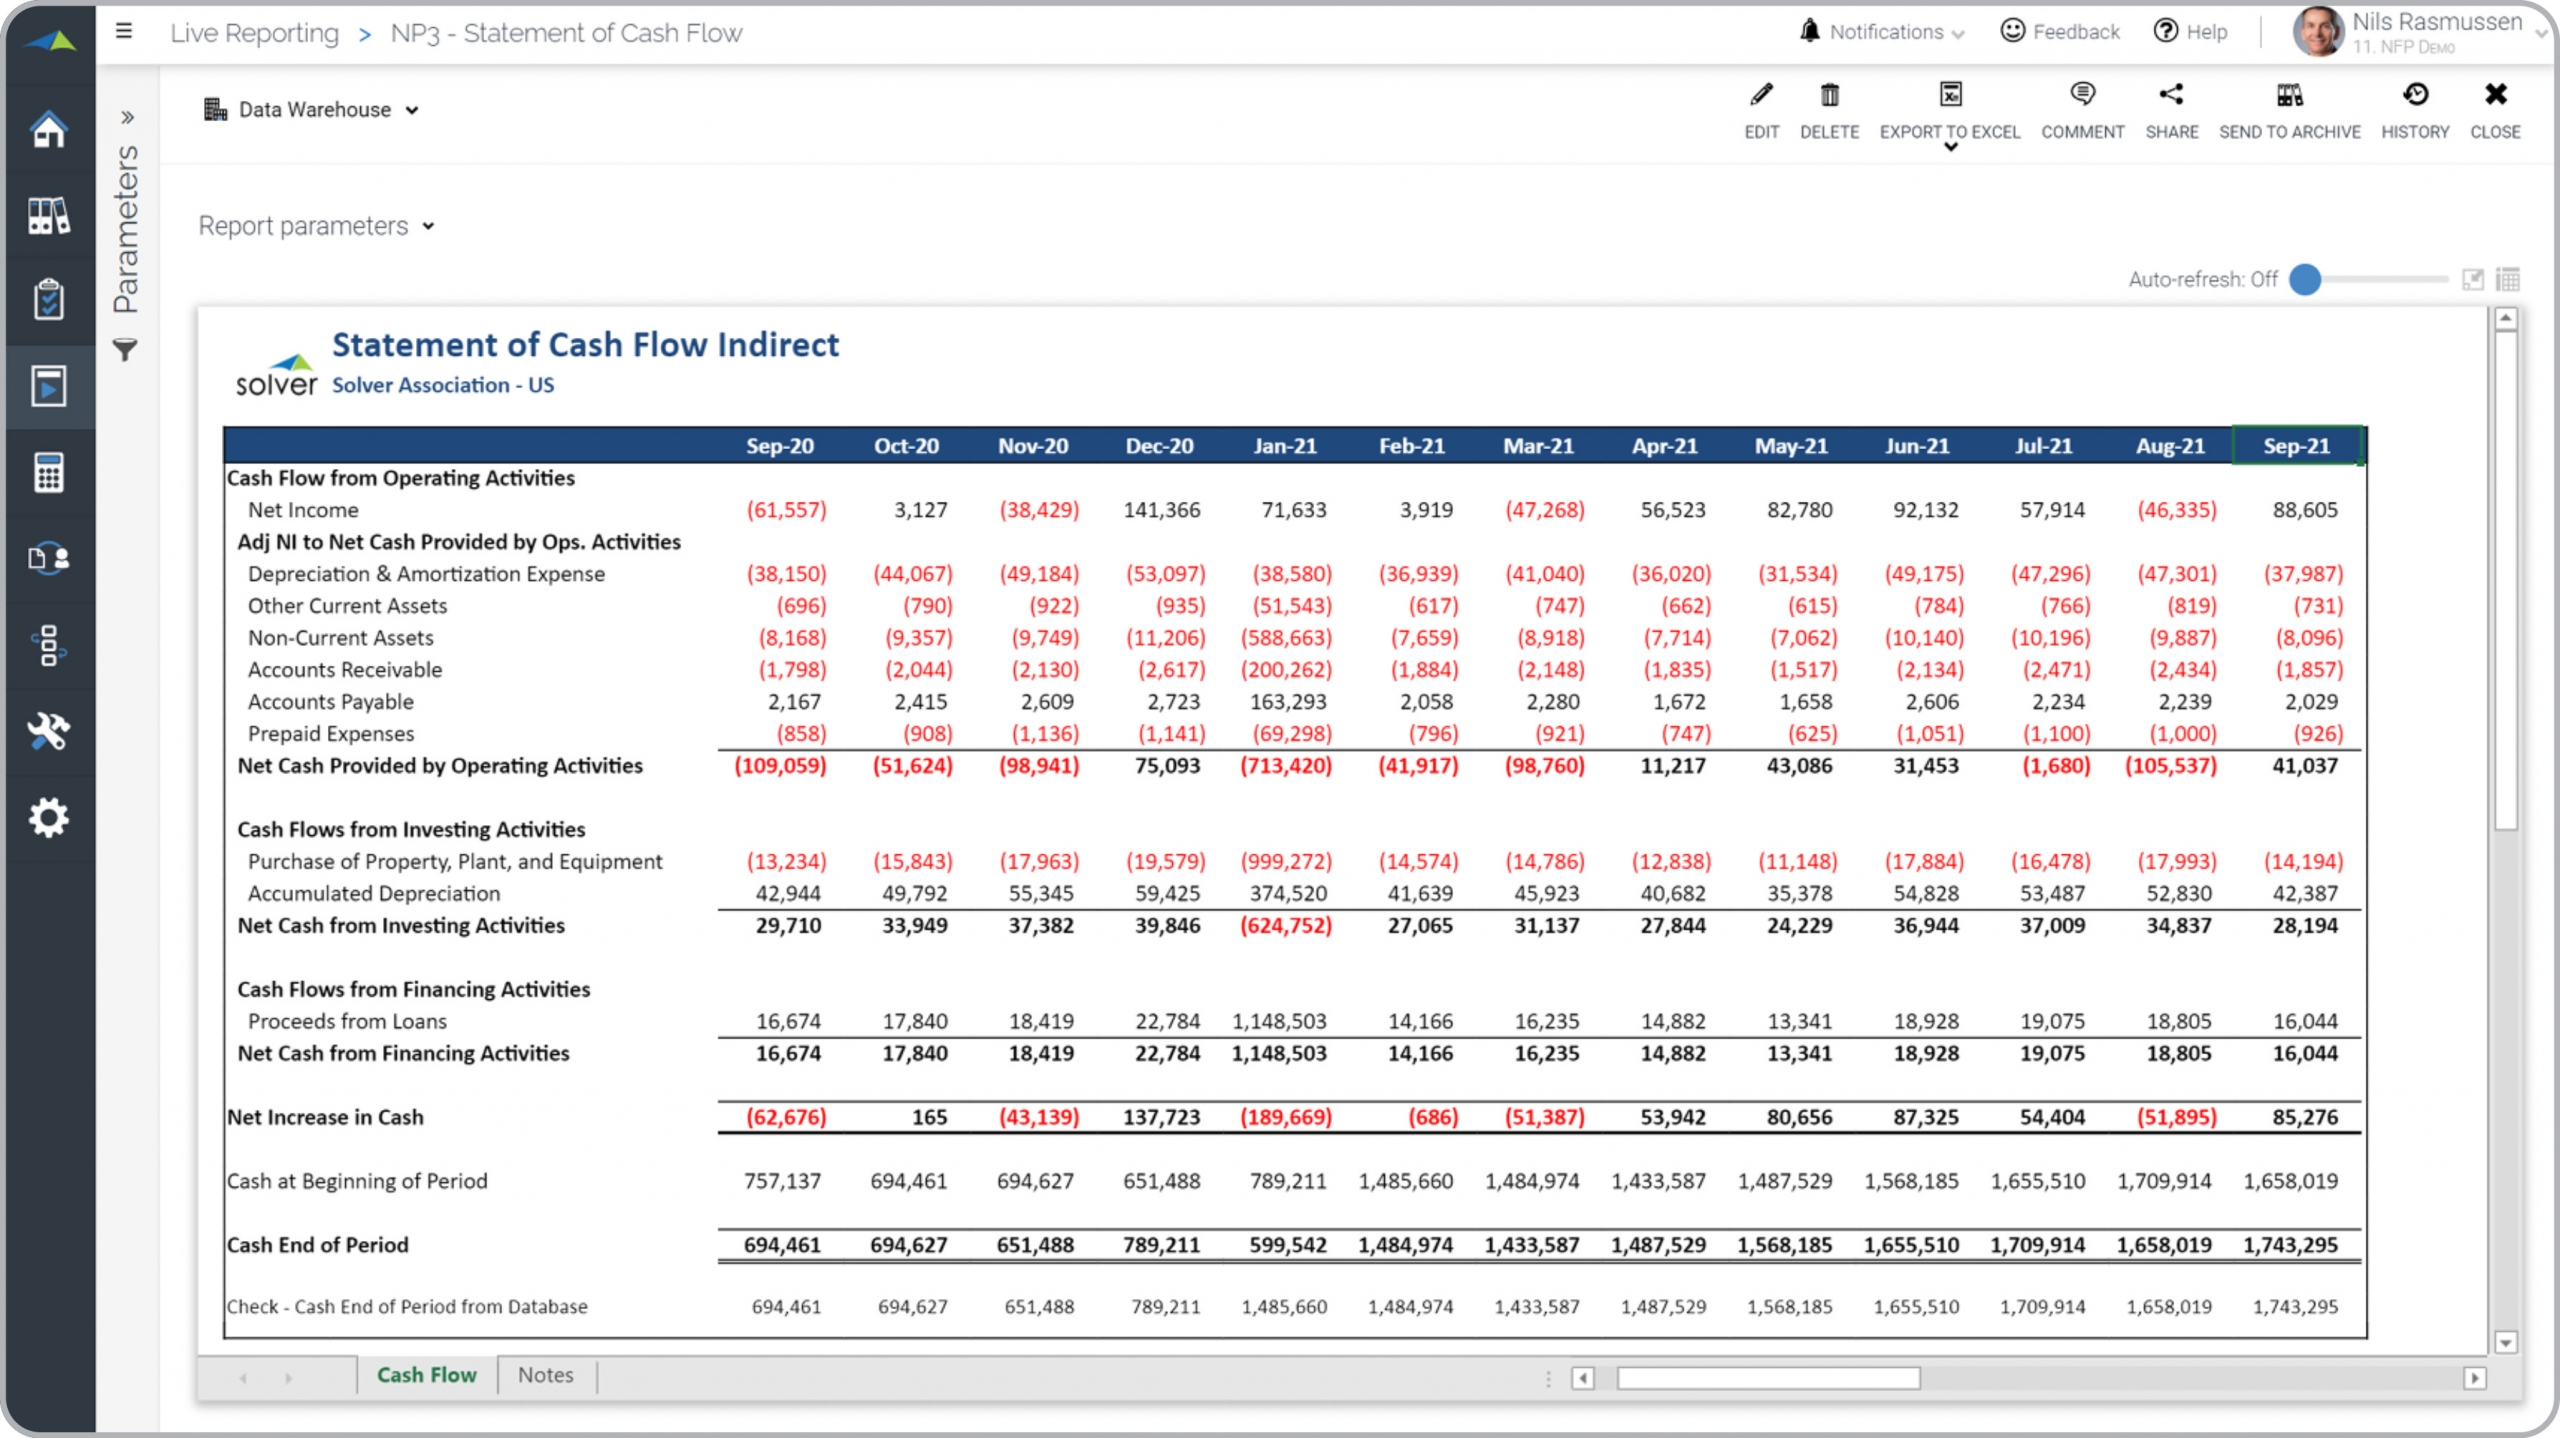
What is a Statement of Cash Flow for a Nonprofit Organization? Trend-based Cash flow statements are considered key monthly financial reports and are used by CFOs and accountants to analyze trends in cash outflows and inflows. Some of the key functionality in this type of trend report is that it based on the month the user runs the report for, it will dynamically show the past 13 months. In other words, it is a rolling, trended statement of cash flows. The provided example is formatted as an indirect cash flow report. You find an example of this type of trend report below.
Purpose of Statement of Cash Flow Nonprofits and associations use Statement of Cash Flow to monitor trends that affect the organization's cash position. When used as part of good business practices in a Financial Planning & Analysis (FP&A) department, an organization can improve its liquidity as well as reduce the chances that cash crunches occur.
Who Uses This Type of Trend report? The typical users of this type of trend report are: Executives, CFOs, analysts and accountants. Other Trend reports Often Used in Conjunction with Statement of Cash Flow Progressive Financial Planning & Analysis (FP&A) departments sometimes use several different statement of cash flow, along with balance sheets, statement of activities, financial dashboards, budget and forecast models and other management and control tools.
Where Does the Data for Analysis Originate From? The Actual (historical transactions) data comes from enterprise resource planning (ERP) systems like: Microsoft Dynamics 365 (D365) Finance, Microsoft Dynamics 365 Business Central (D365 BC), Microsoft Dynamics AX, Microsoft Dynamics NAV, Microsoft Dynamics GP, Microsoft Dynamics SL, Sage Intacct, Sage 100, Sage 300, Sage 500, Sage X3, SAP Business One, SAP ByDesign, Acumatica, Netsuite and others. In analyses where budgets or forecasts are used, the planning data most often originates from in-house Excel spreadsheet models or from professional xFP&A solutions.
Built for nonprofit finance teams and aligned with Solver's xFP&A platform, this Solver report template connects directly to your ERP data via the Solver Data Warehouse, enabling near real-time analysis with minimal setup. Designed for QuickStart deployment, it can be activated rapidly so your team can focus on analysis and decisions — not data preparation.
What is the Nonprofit – Statement of Cash Flow in Solver? The Nonprofit – Statement of Cash Flow is a pre-built xFP&A report template in Solver designed for nonprofit organizations. It delivers key financial and operational metrics in a single, easy-to-use interface — purpose-built for nonprofit finance workflows.
Who uses this Solver report template? This template is primarily used by CFOs, controllers, and nonprofit finance teams in nonprofit organizations who need accurate, timely data to support planning, reporting, and decision-making. It is particularly valuable for nonprofit finance teams managing budgets, forecasts, and performance reviews.
Where does the data come from? Data is sourced automatically from your ERP system through the Solver Data Warehouse, which integrates with platforms such as Microsoft Dynamics 365 Business Central, Dynamics 365 Finance, Acumatica, Sage Intacct, and other leading ERP solutions. Once connected, the template updates in near real-time with no manual data entry required.
To learn more, visit the Resource Library.