
Retail – Average Selling Price Budget
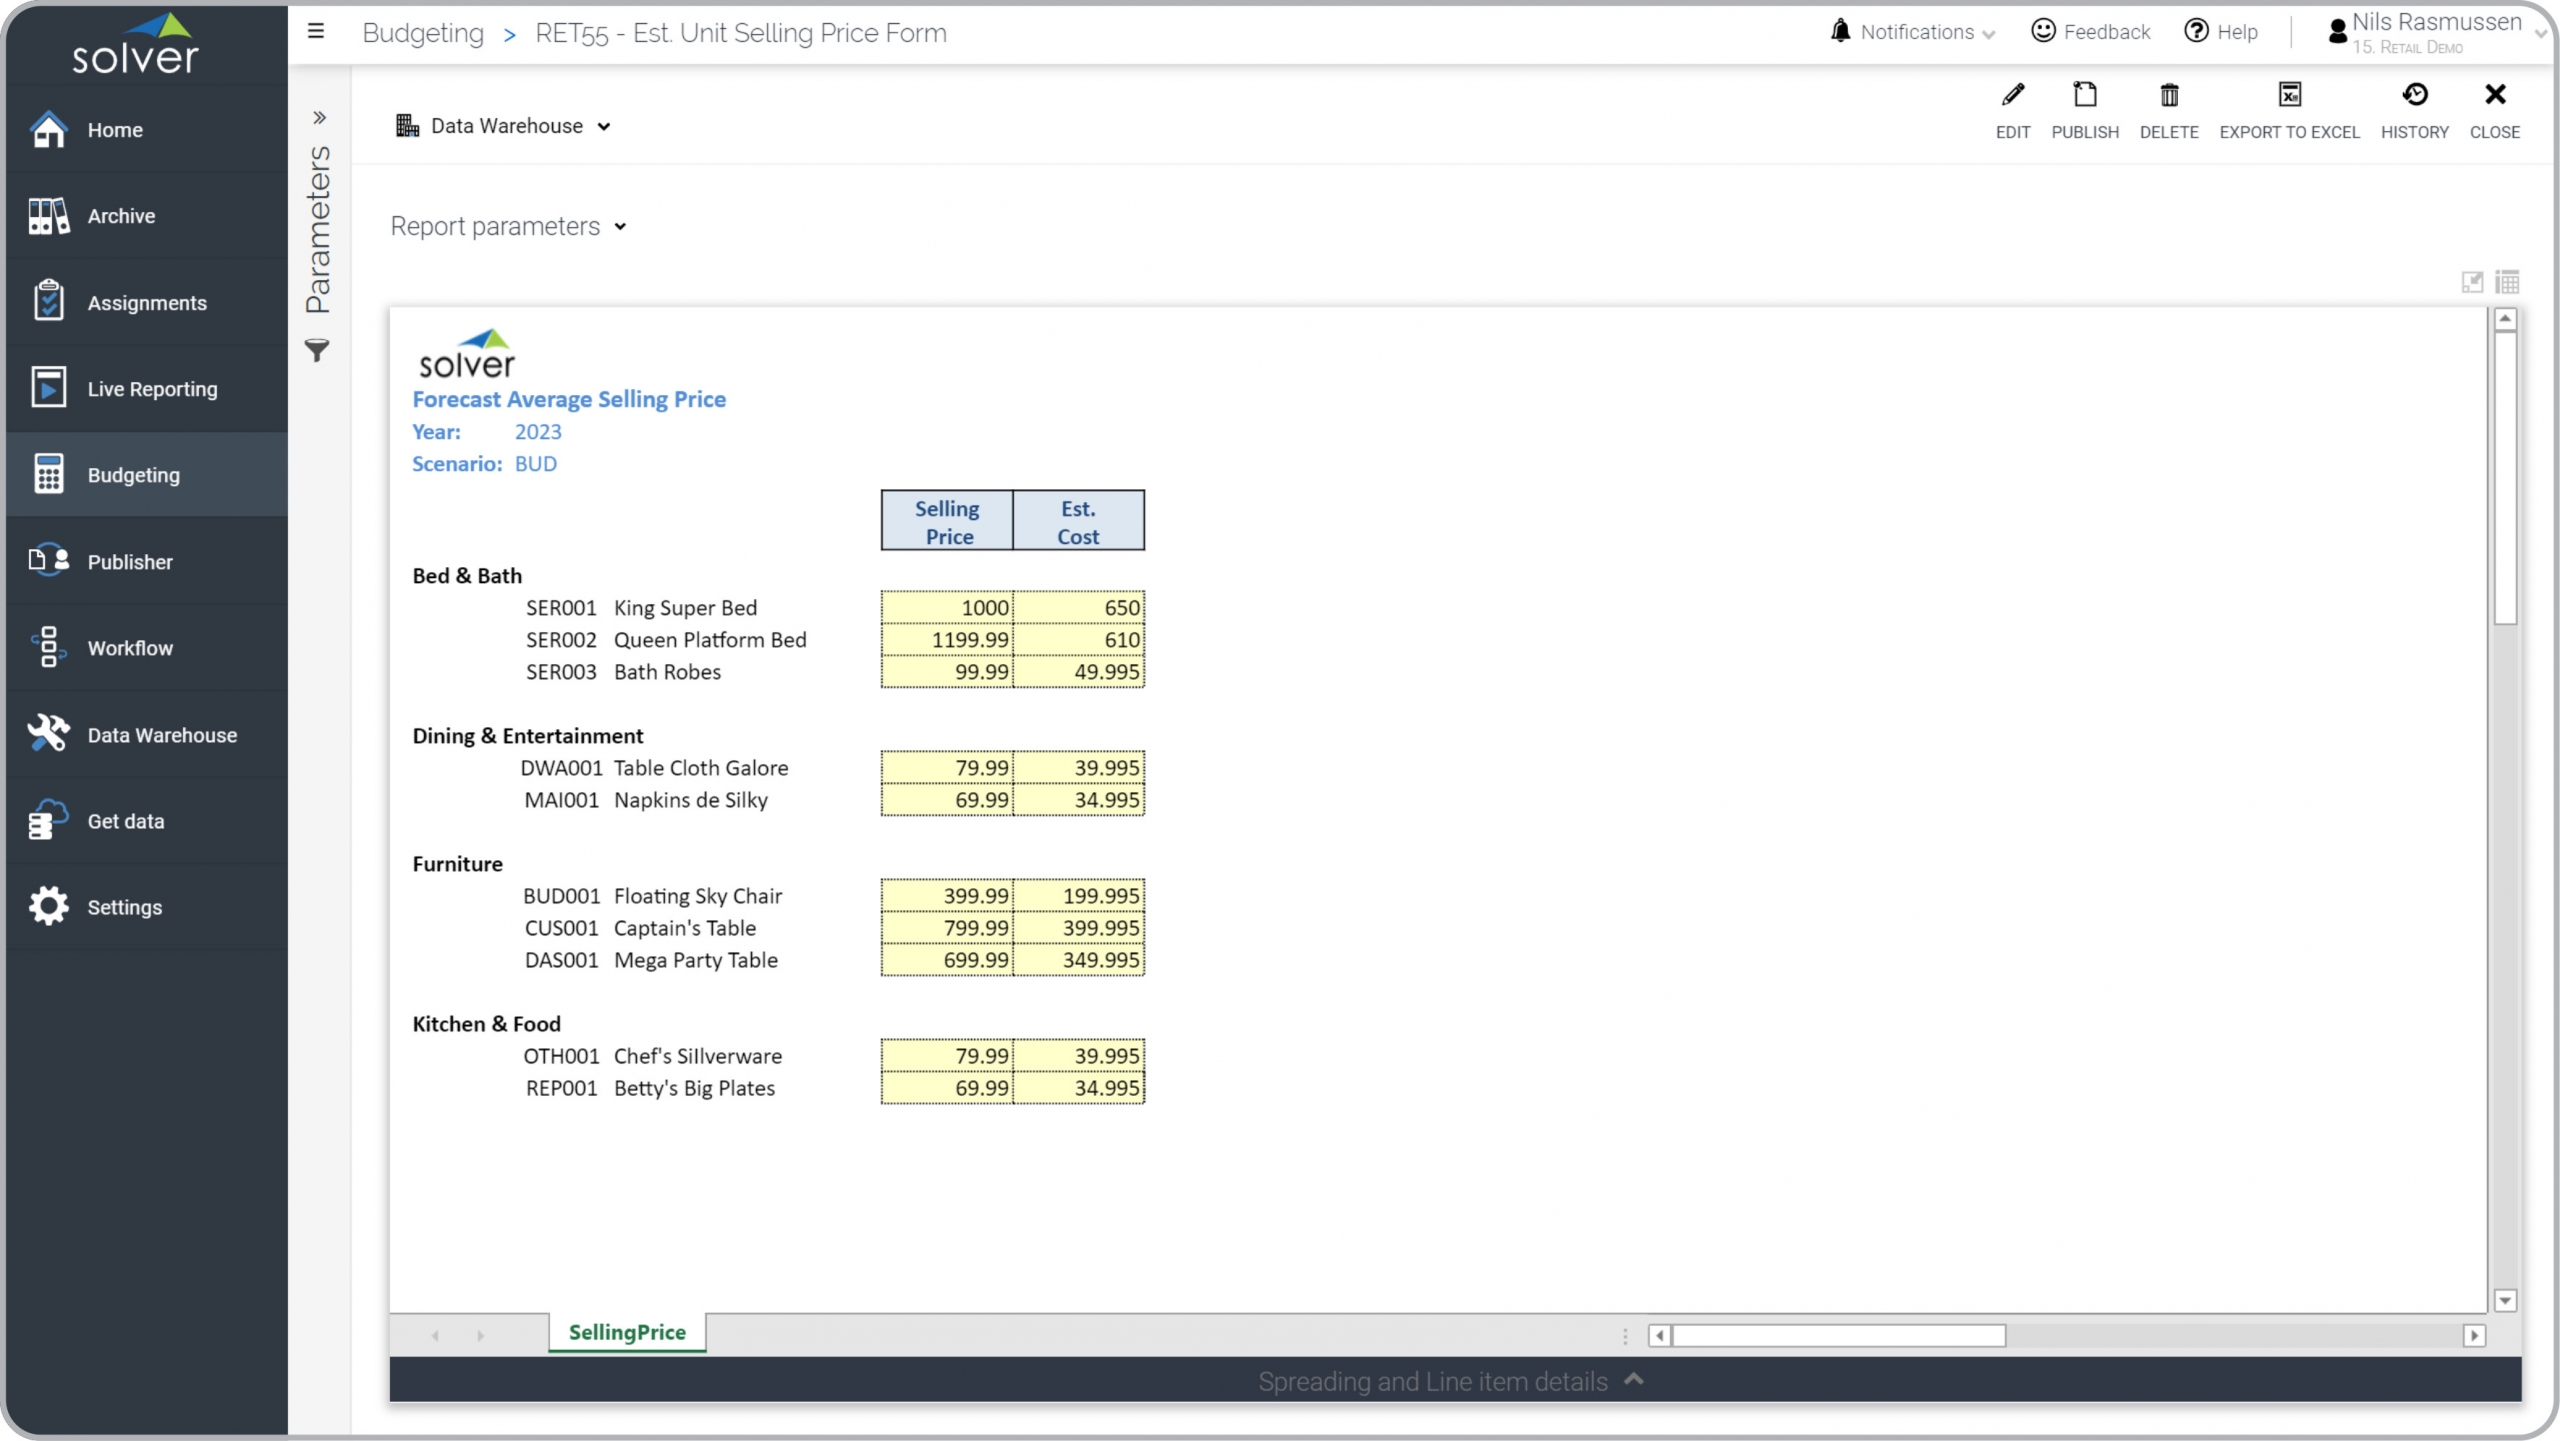
What is a Sales Price and Cost Budget per Product? Product price and cost budget templates are considered an essential component of a retail sales budget or forecast and are used by regional sales executives and store managers to plan for weekly or monthly sales. Key functionality in this type of input form displays items by product group down the rows and Price and Cost in the columns. Using budget versioning, multiple price and cost scenarios can be created. The resulting figures are pulled up in a Quantity input template and used to calculate the total expected sales revenue per item. While a corporate user often enters the price and cost in this template, it is typical that regional managers or store managers later capture the forecasted sales quantities. You will find an example of this type of input form below.
Purpose of Product Price and Cost Models Retail companies use Product Price and Cost Models to easily capture detailed estimates per item that is then multiplied with sales quantity forecasts to drive the total sales revenue per product, store, region and when consolidated. When used as part of good business practices in a Financial Planning & Analysis (FP&A) department, a retail corporation can improve its sales forecast accuracy which helps to budget for expenses and investments, as well as, reduce the chances that inventories end up too high or too low.
Who Uses This Type of Input Form? The typical users of this type of input form are: Budget managers, regional sales managers, product managers. Other Input Forms Often Used in Conjunction with Product Price and Cost Models Progressive Financial Planning & Analysis (FP&A) Departments sometimes use several different Product Price and Cost Models, along with sales quantity budgets, capex, operating expenses, cash flow plans and other management and control tools.
Where Does the Data for Analysis Originate From? The Actual (historical transactions) data typically comes from enterprise resource planning (ERP) systems like: Microsoft Dynamics 365 (D365) Finance, Microsoft Dynamics 365 Business Central (D365 BC), Microsoft Dynamics AX, Microsoft Dynamics NAV, Microsoft Dynamics GP, Microsoft Dynamics SL, Sage Intacct, Sage 100, Sage 300, Sage 500, Sage X3, SAP Business One, SAP ByDesign, Acumatica, Netsuite and others. In analyses where budgets or forecasts are used, the planning data most often originates from in-house Excel spreadsheet models or from professional xFP&A solutions.
Built for retail finance teams and aligned with Solver's xFP&A platform, this Solver planning template connects directly to your ERP data via the Solver Data Warehouse, enabling near real-time analysis with minimal setup. Designed for QuickStart deployment, it can be activated rapidly so your team can focus on analysis and decisions — not data preparation.
What is the Retail – Average Selling Price Budget in Solver? The Retail – Average Selling Price Budget is a pre-built xFP&A planning template in Solver designed for retail organizations. It delivers key financial and operational metrics in a single, easy-to-use interface — purpose-built for retail finance workflows.
Who uses this Solver planning template? This template is primarily used by CFOs, FP&A managers, and retail finance teams in retail organizations who need accurate, timely data to support planning, reporting, and decision-making. It is particularly valuable for retail finance teams managing budgets, forecasts, and performance reviews.
Where does the data come from? Data is sourced automatically from your ERP system through the Solver Data Warehouse, which integrates with platforms such as Microsoft Dynamics 365 Business Central, Dynamics 365 Finance, Acumatica, Sage Intacct, and other leading ERP solutions. Once connected, the template updates in near real-time with no manual data entry required.
To learn more, visit the Resource Library.