

Pipeline and Sales Combo Report
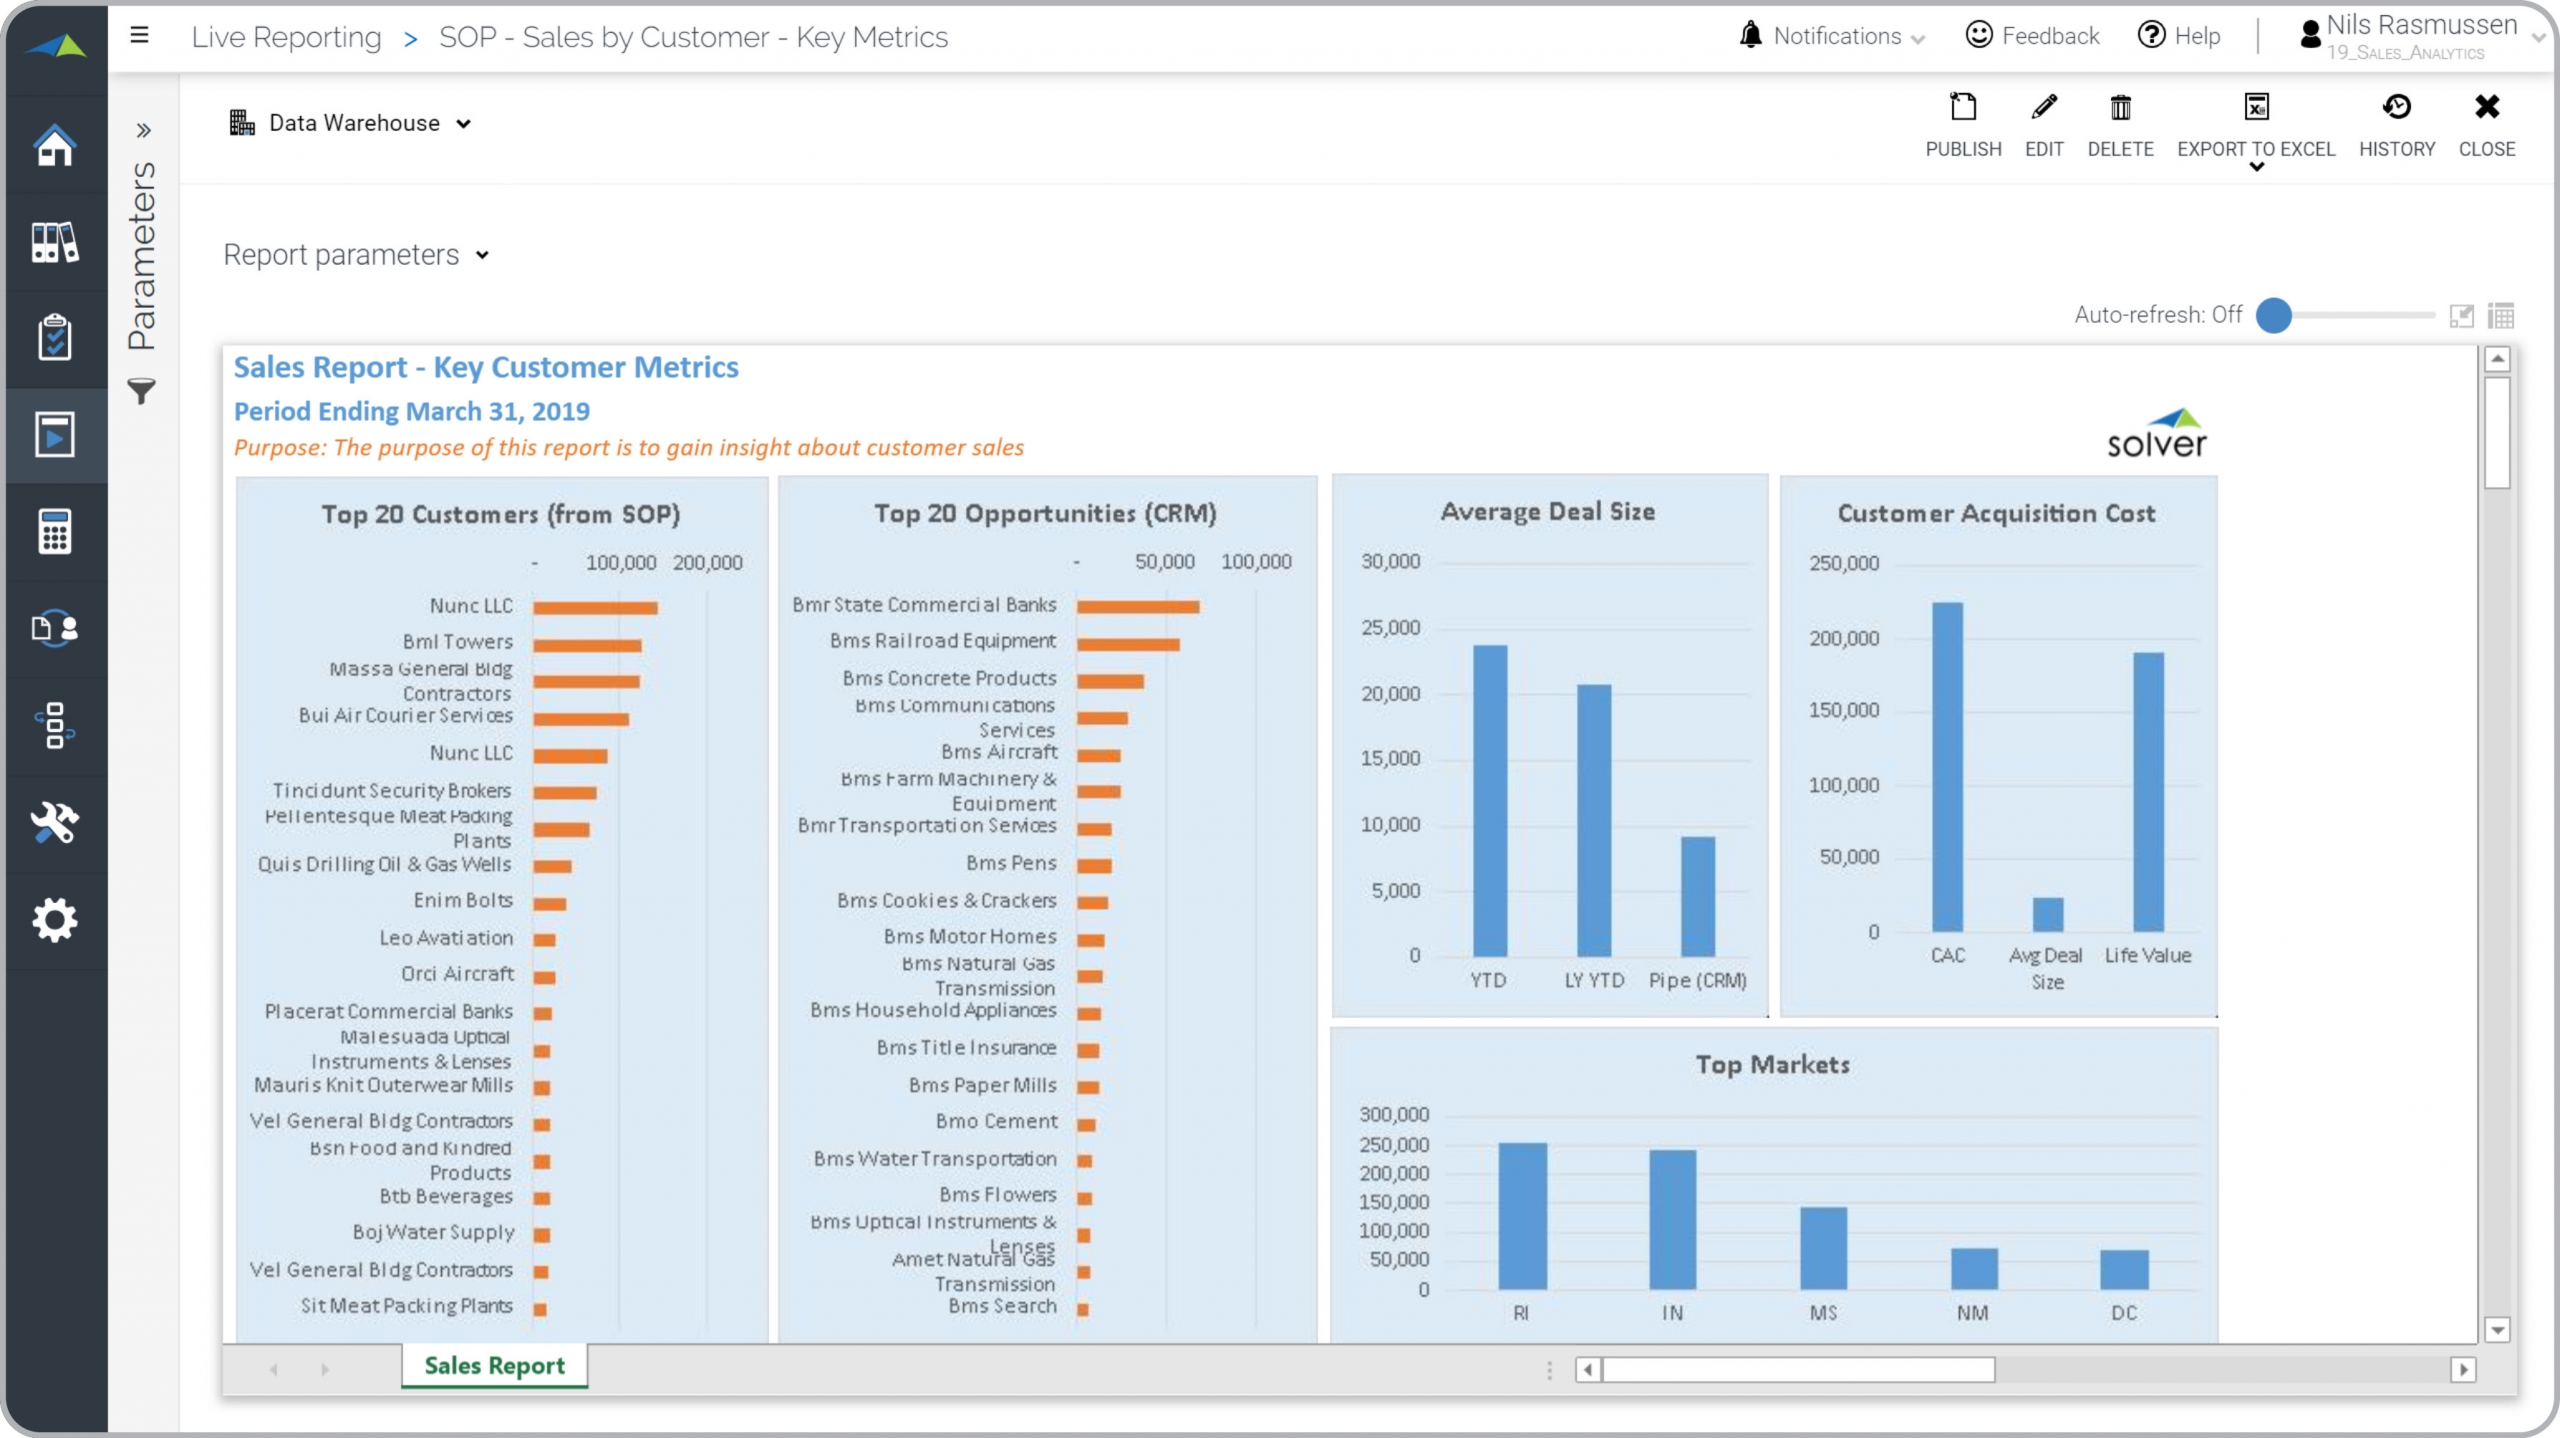
What is a Sales and Opportunity Report with Customer Metrics? Graphical reports that combine CRM opportunity pipeline data with actual sales metrics are considered sales dashboards and are often used by sales executives and sales team members to analyze what type of deals the company is doing, where and at what cost. Some of the functionality in this type of dashboard report is that it uses charts to present key sales metrics and it also (not visible in the screenshot below) lists all the transactions used in the analysis so that users can drill down to detail. Some of the answers provided by the report are: Top 20 customers that was invoiced in the period (from the ERP sales order system), Top 20 opportunities (from the CRM system), the Average deal size this year versus last year versus in the pipeline, the cost of acquiring a customer, and top markets for the won deals. You find an example of this type of dashboard report below.
Purpose of Sales and Opportunity Reports with Customer Metrics Companies and organizations use Sales and Opportunity Reports with Customer Metrics to easily analyze customer data from various angles to find improvement opportunities. When used as part of good business practices in a Sales department, a company can improve its sales revenues and related marketing tactics as well as reduce the chances that important customer trends go undetected.
Who Uses This Type of Dashboard report? The typical users of this type of dashboard report are: Sales managers, sales team members, marketing managers. Other Dashboard reports Often Used in Conjunction with Sales and Opportunity Reports with Customer Metrics Progressive Sales Departments sometimes use several different Sales and Opportunity Reports with Customer Metrics, along with sales summary reports, sales dashboards, customer acquisition reports, opportunity pipeline reports and profit & loss reports and other management and control tools.
Where Does the Data for Analysis Originate From? The Actual (historical transactions) data typically comes from CRM and enterprise resource planning (ERP) systems like: Microsoft Dynamics 365 (D365) Finance, Microsoft Dynamics 365 Business Central (D365 BC), Microsoft Dynamics 365 (CRM), Microsoft Dynamics AX, Microsoft Dynamics NAV, Microsoft Dynamics GP, Microsoft Dynamics SL, Sage Intacct, Sage 100, Sage 300, Sage 500, Sage X3, SAP Business One, SAP ByDesign, Acumatica, Netsuite, Salesforce, Hubspot and others. In analyses where budgets or forecasts are used, the planning data most often originates from in-house Excel spreadsheet models or from professional xFP&A solutions.
This Solver report template connects directly to your ERP data via the Solver Data Warehouse, enabling near real-time analysis with minimal setup. Designed for QuickStart deployment, it can be activated rapidly so your team can focus on analysis and decisions — not data preparation.
What is the Pipeline and Sales Combo Report in Solver? The Pipeline and Sales Combo Report is a pre-built xFP&A report template in Solver that delivers key financial and operational metrics in a single, easy-to-use interface, eliminating the need for manual data work or custom report development.
Who uses this Solver report template? Cfos, fp&a managers, and controllers rely on this Solver report template for consistent, parameter-driven reporting that can be run on demand or on a scheduled basis. It eliminates the manual work typically required to produce this type of analysis.
Where does the data come from? Data is sourced automatically from your ERP system through the Solver Data Warehouse, which integrates with platforms such as Microsoft Dynamics 365 Business Central, Dynamics 365 Finance, Acumatica, Sage Intacct, and other leading ERP solutions. Once connected, the template updates in near real-time with no manual data entry required.
To learn more, visit the Resource Library.