

Hospitality – Hotel & Resort Monthly Operating Summary
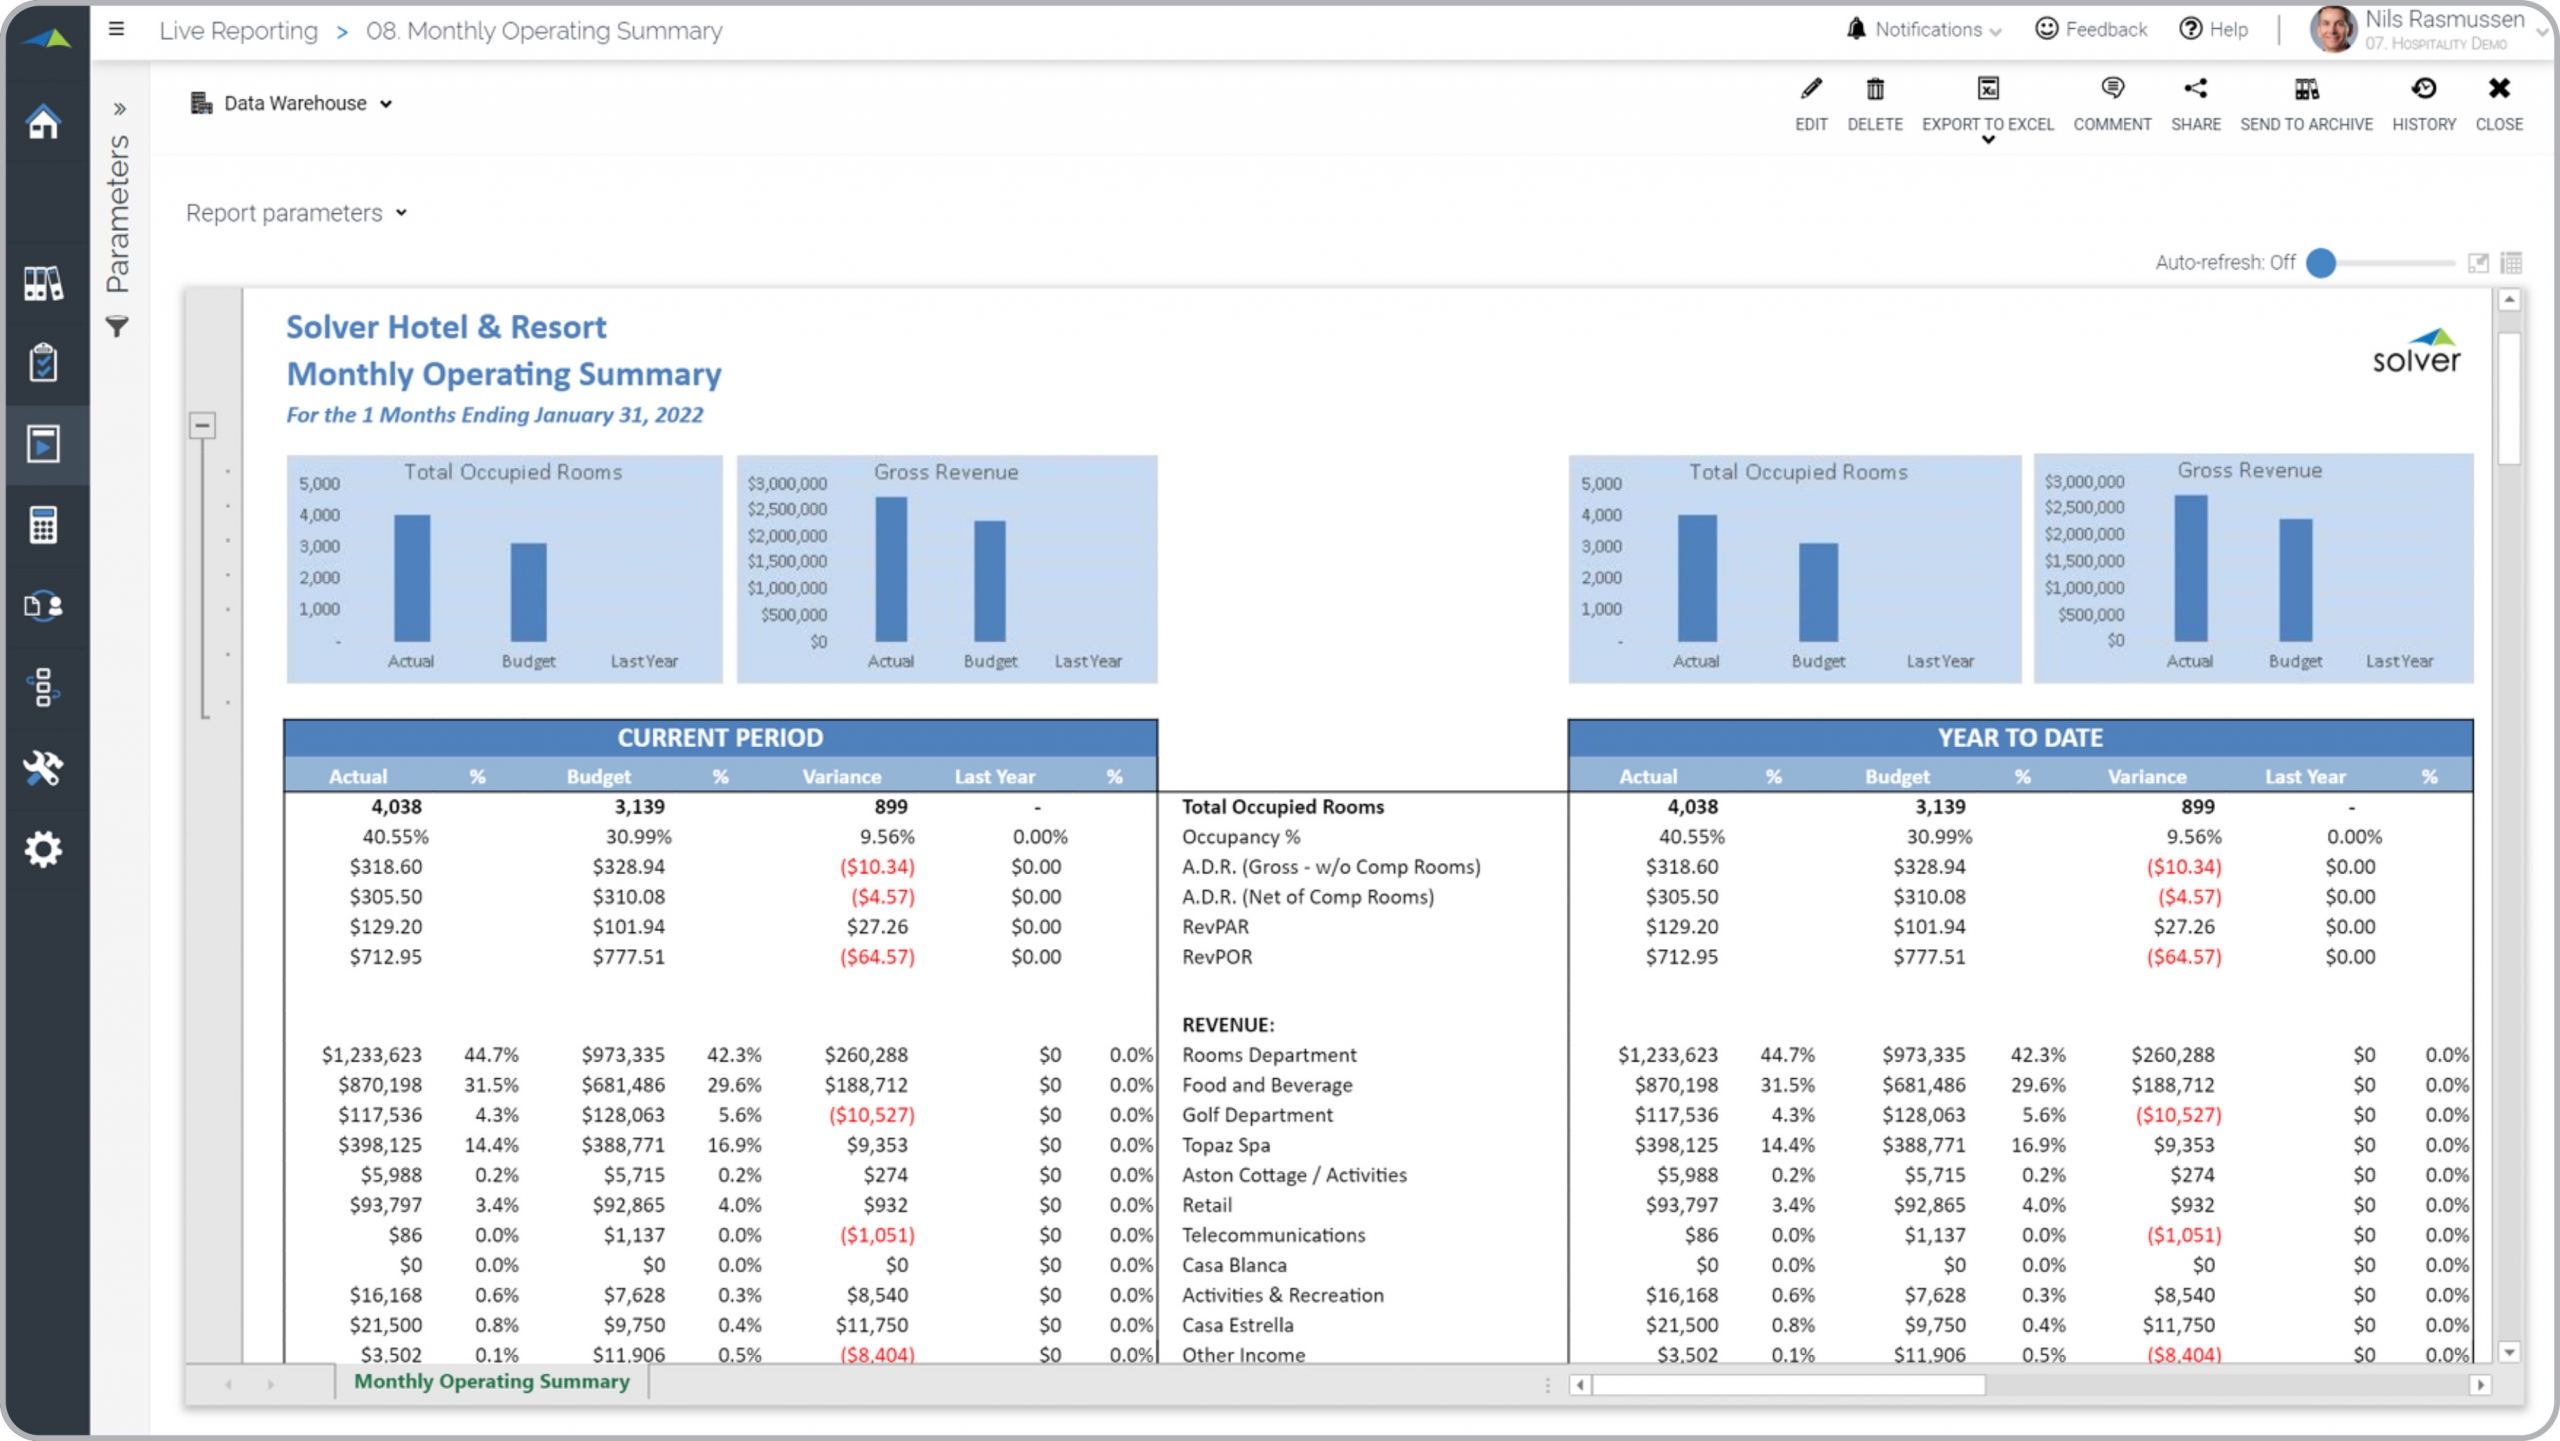
What is a Monthly Operating Summary Report? Operating Summary Reports are considered business- and departmental analysis tools and are used by financial managers and executives to analyze key metrics, revenues and profitability. Some of the main functionality in this type of report is that it combines KPIs with financial summaries. The top of the report shows charts with Total Occupied Rooms and Revenue for monthly and year-to-date (YTD) figures. The top section with figures shows KPIs with actual, budget, last year and variances. The next two sections show revenue and profitability (not visible in the screenshot below) by department. The bottom of each section shows the company-level total revenue and profit. You find an example of this type of report below.
Purpose of Monthly Operational Summary Reports Hospitality companies use Operational Summary Reports to provide managers with a combined departmental and summary view of the company's top metrics. When used as part of good business practices in Executive- and FP&A departments, a company can improve its operational tactics and profitability, and it can reduce the chances that leaders don't have a convenient way to see the relationship between department and company revenue and profitability.
Who Uses This Type of Report? The typical users of this type of report are: CFOs, analysts, budget managers, department managers. Other Reports Often Used in Conjunction with Operational Summary Reports Progressive Executive- and FP&A departments sometimes use several different Operational Summary Reports, along with company financial statements, department P&L's, forecast models, budgets, KPI scorecards and other management and control tools.
Where Does the Data for Analysis Originate From? The Actual (historical transactions) data typically comes from enterprise resource planning (ERP) systems like: Microsoft Dynamics 365 (D365) Finance, Microsoft Dynamics 365 Business Central (D365 BC), Microsoft Dynamics AX, Microsoft Dynamics NAV, Microsoft Dynamics GP, Microsoft Dynamics SL, Sage Intacct, Sage 100, Sage 300, Sage 500, Sage X3, SAP Business One, SAP ByDesign, Acumatica, Netsuite and others. In analyses where budgets or forecasts are used, the planning data most often originates from in-house Excel spreadsheet models or from professional xFP&A solutions.
Built for hospitality finance teams and aligned with Solver's xFP&A platform, this Solver report template connects directly to your ERP data via the Solver Data Warehouse, enabling near real-time analysis with minimal setup. Designed for QuickStart deployment, it can be activated rapidly so your team can focus on analysis and decisions — not data preparation.
What is the Hospitality – Hotel & Resort Monthly Operating Summary in Solver? The Hospitality – Hotel & Resort Monthly Operating Summary is a pre-built xFP&A report template in Solver designed for hospitality organizations. It delivers key financial and operational metrics in a single, easy-to-use interface — purpose-built for hospitality finance workflows.
Who uses this Solver report template? Finance leaders at hospitality organizations — including CFOs, FP&A managers, and hospitality finance teams — use this template to get fast, reliable answers without waiting on IT or building custom reports. It supports both day-to-day monitoring and strategic decision-making.
Where does the data come from? Data is sourced automatically from your ERP system through the Solver Data Warehouse, which integrates with platforms such as Microsoft Dynamics 365 Business Central, Dynamics 365 Finance, Acumatica, Sage Intacct, and other leading ERP solutions. Property management systems (PMS) and point-of-sale data can also be integrated for full hotel and venue revenue visibility. Once connected, the template updates in near real-time with no manual data entry required.
To learn more, visit the Resource Library.