
Higher Ed – Surplus (Deficit) Simulation
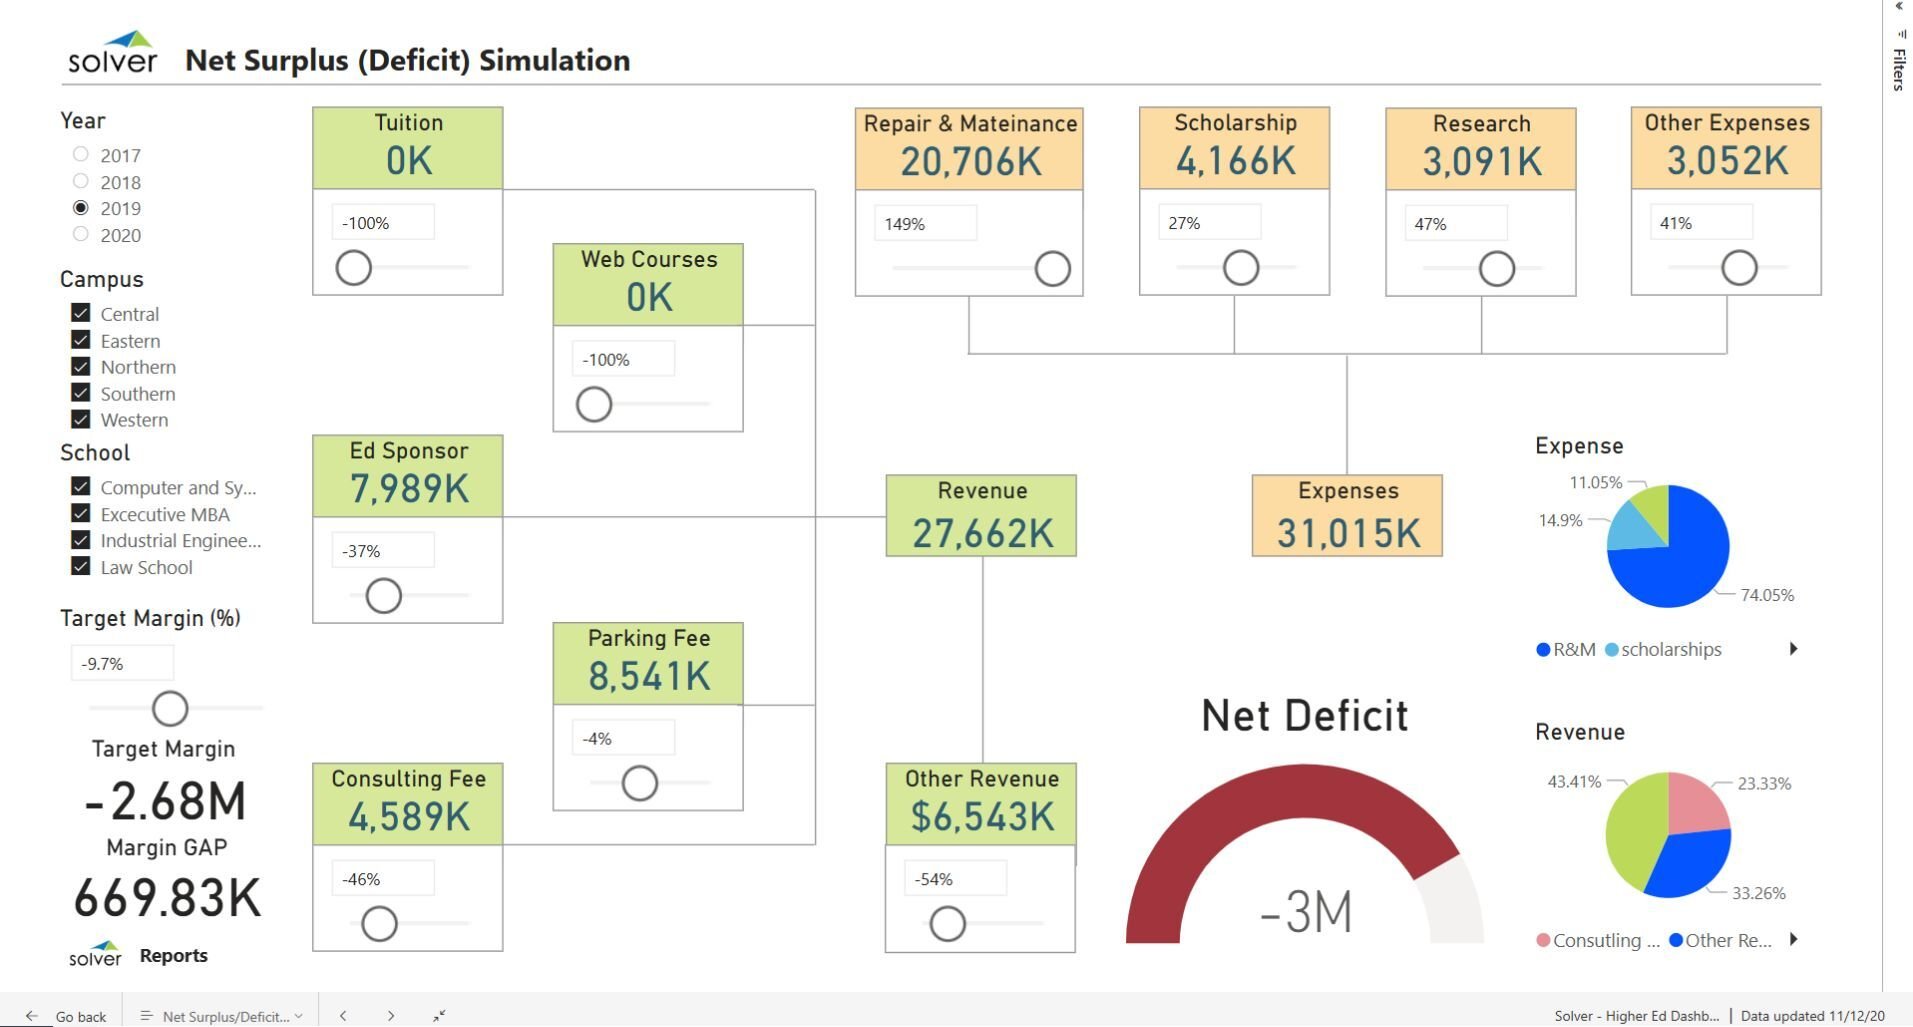
What is a Financial Simulation Dashboard for Higher Education? Financial Simulation Dashboards are considered modelling tools and are used by CFOs and analysts to quickly and easily perform what-if analysis to forecast potential outcomes for revenues, expenses and the resulting surplus or deficit. They can use this interactive simulation dashboard to estimate monthly results, and they can also use it to set targets as input for the annual budget or mid-year forecasts. Some of the main functionality in this type of dashboard is that it provides "sliders" that the user move left or right to make estimates, and the results are immediately displayed in the Surplus/Deficit gauge and charts. The dashboard has the following components: 1) A slider to set the target Margin in %. This then calculates the Margin amount and displays the gap to get there based on the Revenues and Expenses in the simulation, 2) Sliders to adjust all major revenue categories up or down. In the example, these categories include: Tuition, web courses, educational sponsors (grants, donations, etc.), parking fees, consulting fees, 3) Sliders to adjust major Expense components. In the example, these include: Repairs and maintenance, scholarships, research, other expenses, 4) Gauge that calculates the resulting Surplus (or deficit), and 5) Two pie charts that show the breakdown of the simulated revenues and expenses. The filters on the far left enable the user to create scenarios for specific schools, campuses and years. You find an example of this type of interactive dashboard below.
Purpose of Financial Simulation Dashboards Universities and colleges use Financial Simulation Dashboards to give financial managers a very easy way to create scenarios, and to do what-if analysis and modelling. When used as part of good business practices in Financial Planning & Analysis (FP&A) departments, an organization can optimize its decisions by improving planning agility and speed, and it can reduce the chances that cumbersome models limits the organization's planning capabilities to only be focused on the annual budget process.
Who Uses This Type of Dashboard? The typical users of this type of dashboard are: CFOs, analysts, budget managers. Other Reports Often Used in Conjunction with Financial Simulation Dashboards Progressive Financial Planning & Analysis (FP&A) departments sometimes use several different Financial Simulation Dashboards, along with Financial statements, financial dashboards, annual budget models, forecast models and other management and control tools.
Where Does the Data for Analysis Originate From? The Actual (historical transactions) data typically comes from enterprise resource planning (ERP) systems like: Microsoft Dynamics 365 (D365) Finance, Microsoft Dynamics 365 Business Central (D365 BC), Microsoft Dynamics AX, Microsoft Dynamics NAV, Microsoft Dynamics GP, Microsoft Dynamics SL, Sage Intacct, Sage 100, Sage 300, Sage 500, Sage X3, SAP Business One, SAP ByDesign, Acumatica, Netsuite and others. In analyses where budgets or forecasts are used, the planning data most often originates from in-house Excel spreadsheet models or from professional xFP&A solutions.
Built for higher education finance teams and aligned with Solver's xFP&A platform, this Solver report template connects directly to your ERP data via the Solver Data Warehouse, enabling near real-time analysis with minimal setup. Designed for QuickStart deployment, it can be activated rapidly so your team can focus on analysis and decisions — not data preparation.
What is the Higher Ed – Surplus (Deficit) Simulation in Solver? The Higher Ed – Surplus (Deficit) Simulation is a pre-built xFP&A report template in Solver designed for higher education organizations. It delivers key financial and operational metrics in a single, easy-to-use interface — purpose-built for higher education finance workflows.
Who uses this Solver report template? Cfos, controllers, and higher education finance teams in higher education organizations rely on this Solver report template to replace manual spreadsheet-based processes with automated, near real-time analysis. It is especially useful during month-end close, budget cycles, and board reporting.
Where does the data come from? Data is sourced automatically from your ERP system through the Solver Data Warehouse, which integrates with platforms such as Microsoft Dynamics 365 Business Central, Dynamics 365 Finance, Acumatica, Sage Intacct, and other leading ERP solutions. Once connected, the template updates in near real-time with no manual data entry required.
To learn more, visit the Resource Library.