
Trial Balance – Consolidating
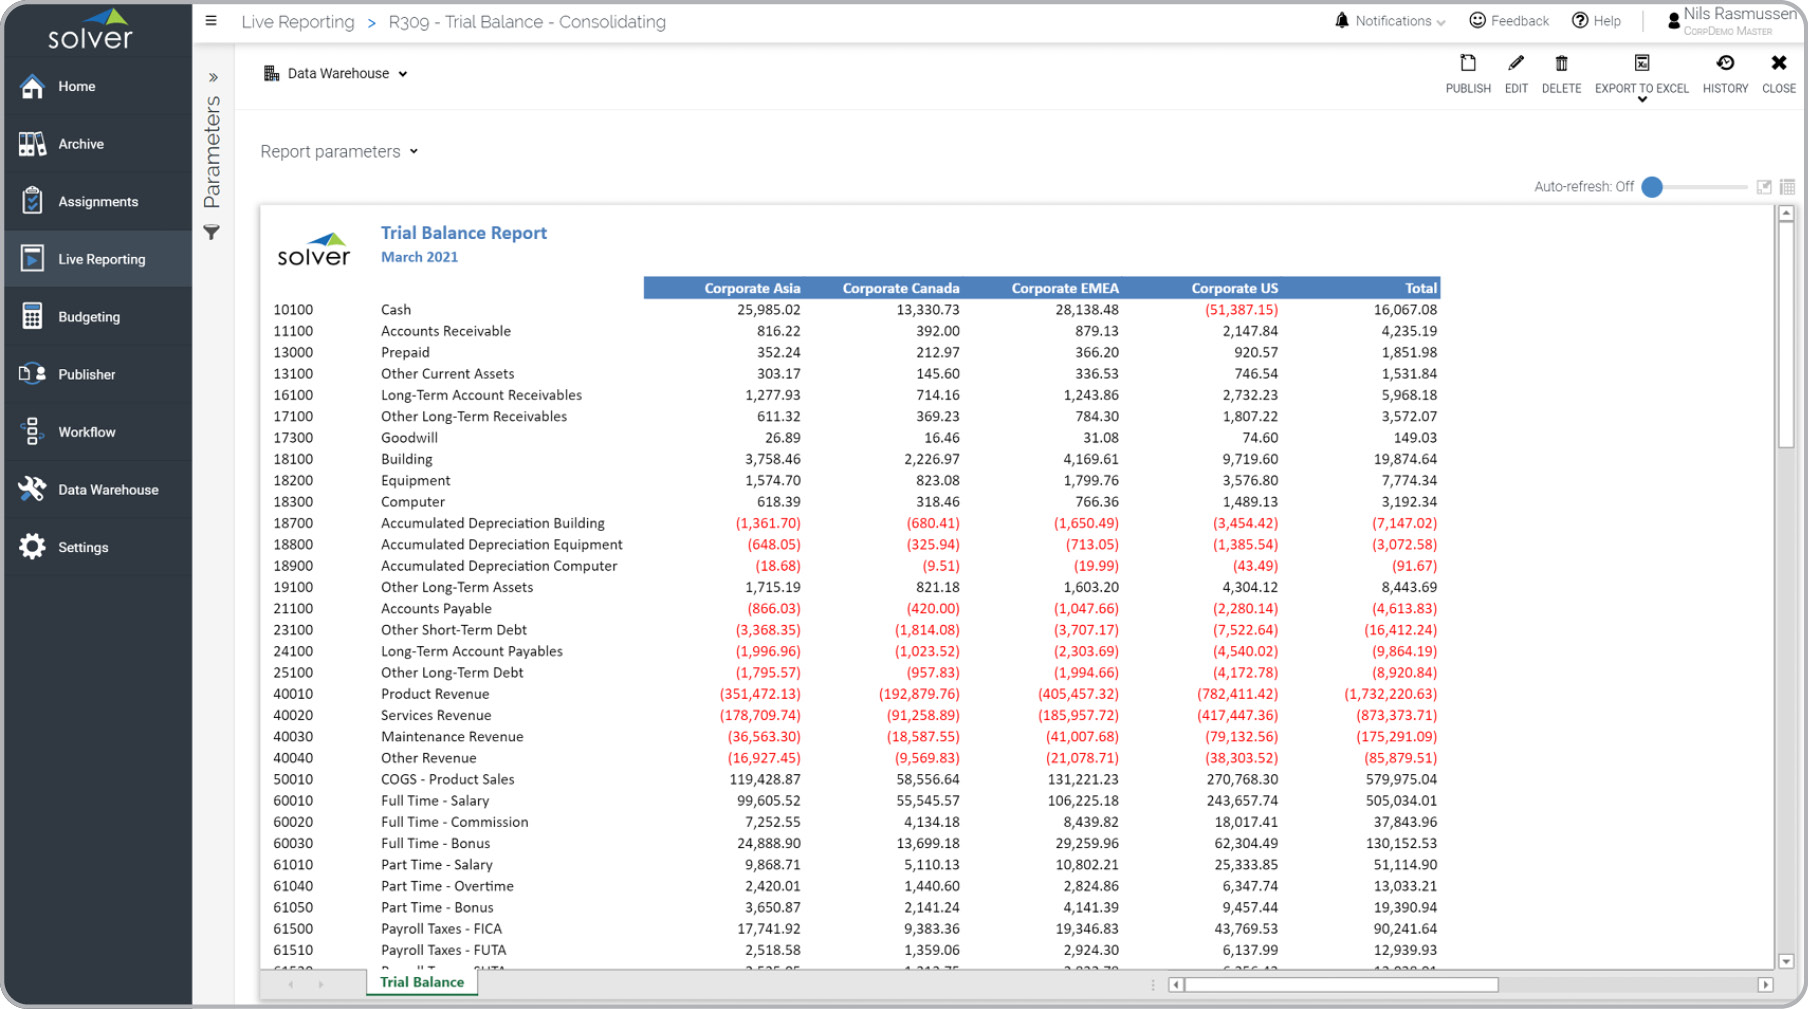
What is a Consolidating Trial Balance? Consolidating Trial Balance Reports are considered essential control tools and are used by Group Controllers to ensure that the financial transactions supplied from subsidiaries are in balance. A key functionality in this type of consolidation report lists all financial accounts down the rows with a total that should be zero if everything is correct. Each subsidiary is listed in the columns along with a grand total. The report can be run by each division for their own sub-consolidation as well as for the corporate HQ for its divisions. Drill-down is important so that the controller can easily explore underlying transactions when needed. You will find an example of this type of consolidation report below.
Purpose of Consolidating Trial Balance Reports Companies and organizations use Consolidating Trial Balance Reports to ensure that all subsidiary data is in balance before the rest of the consolidation process continues. When used as part of good business practices in a Finance & Accounting Department, a company can improve its ability to catch problems and improve the closing process, as well as, mitigate the risk that out-of-balance subsidiary data will slow down the time to deliver consolidated financials.
Who Uses This Type of Consolidation Report? The typical users of this type of consolidation report are: Controllers and Accountants. Other Consolidation Reports Often Used in Conjunction with Consolidating Trial Balance Reports Progressive Finance & Accounting Departments sometimes use several different Consolidating Trial Balance Reports, along with intercompany reports, profit & loss, balance sheet and other management and control tools.
Where Does the Data for Analysis Originate From? The Actual (historical transactions) data typically comes from enterprise resource planning (ERP) systems like: Microsoft Dynamics 365 (D365) Finance, Microsoft Dynamics 365 Business Central (D365 BC), Microsoft Dynamics AX, Microsoft Dynamics NAV, Microsoft Dynamics GP, Microsoft Dynamics SL, Sage Intacct, Sage 100, Sage 300, Sage 500, Sage X3, SAP Business One, SAP ByDesign, Netsuite and others. In analyses where budgets or forecasts are used, the planning data most often originates from in-house Excel spreadsheet models or from professional xFP&A solutions.
This Solver report template connects directly to your ERP data via the Solver Data Warehouse, enabling near real-time analysis with minimal setup. Designed for QuickStart deployment, it can be activated rapidly so your team can focus on analysis and decisions — not data preparation.
What is the Trial Balance – Consolidating in Solver? The Trial Balance – Consolidating is a pre-built xFP&A report template in Solver that delivers key financial and operational metrics in a single, easy-to-use interface, eliminating the need for manual data work or custom report development.
Who uses this Solver report template? This template is primarily used by CFOs, FP&A managers, and controllers who need accurate, timely reporting without manual data preparation. It is also valuable for department heads and business unit leaders who need periodic performance summaries.
Where does the data come from? Data is sourced automatically from your ERP system through the Solver Data Warehouse, which integrates with platforms such as Microsoft Dynamics 365 Business Central, Dynamics 365 Finance, Acumatica, Sage Intacct, and other leading ERP solutions. Once connected, the template updates in near real-time with no manual data entry required.
To learn more, visit the Resource Library.