

Cash Flow Simulation
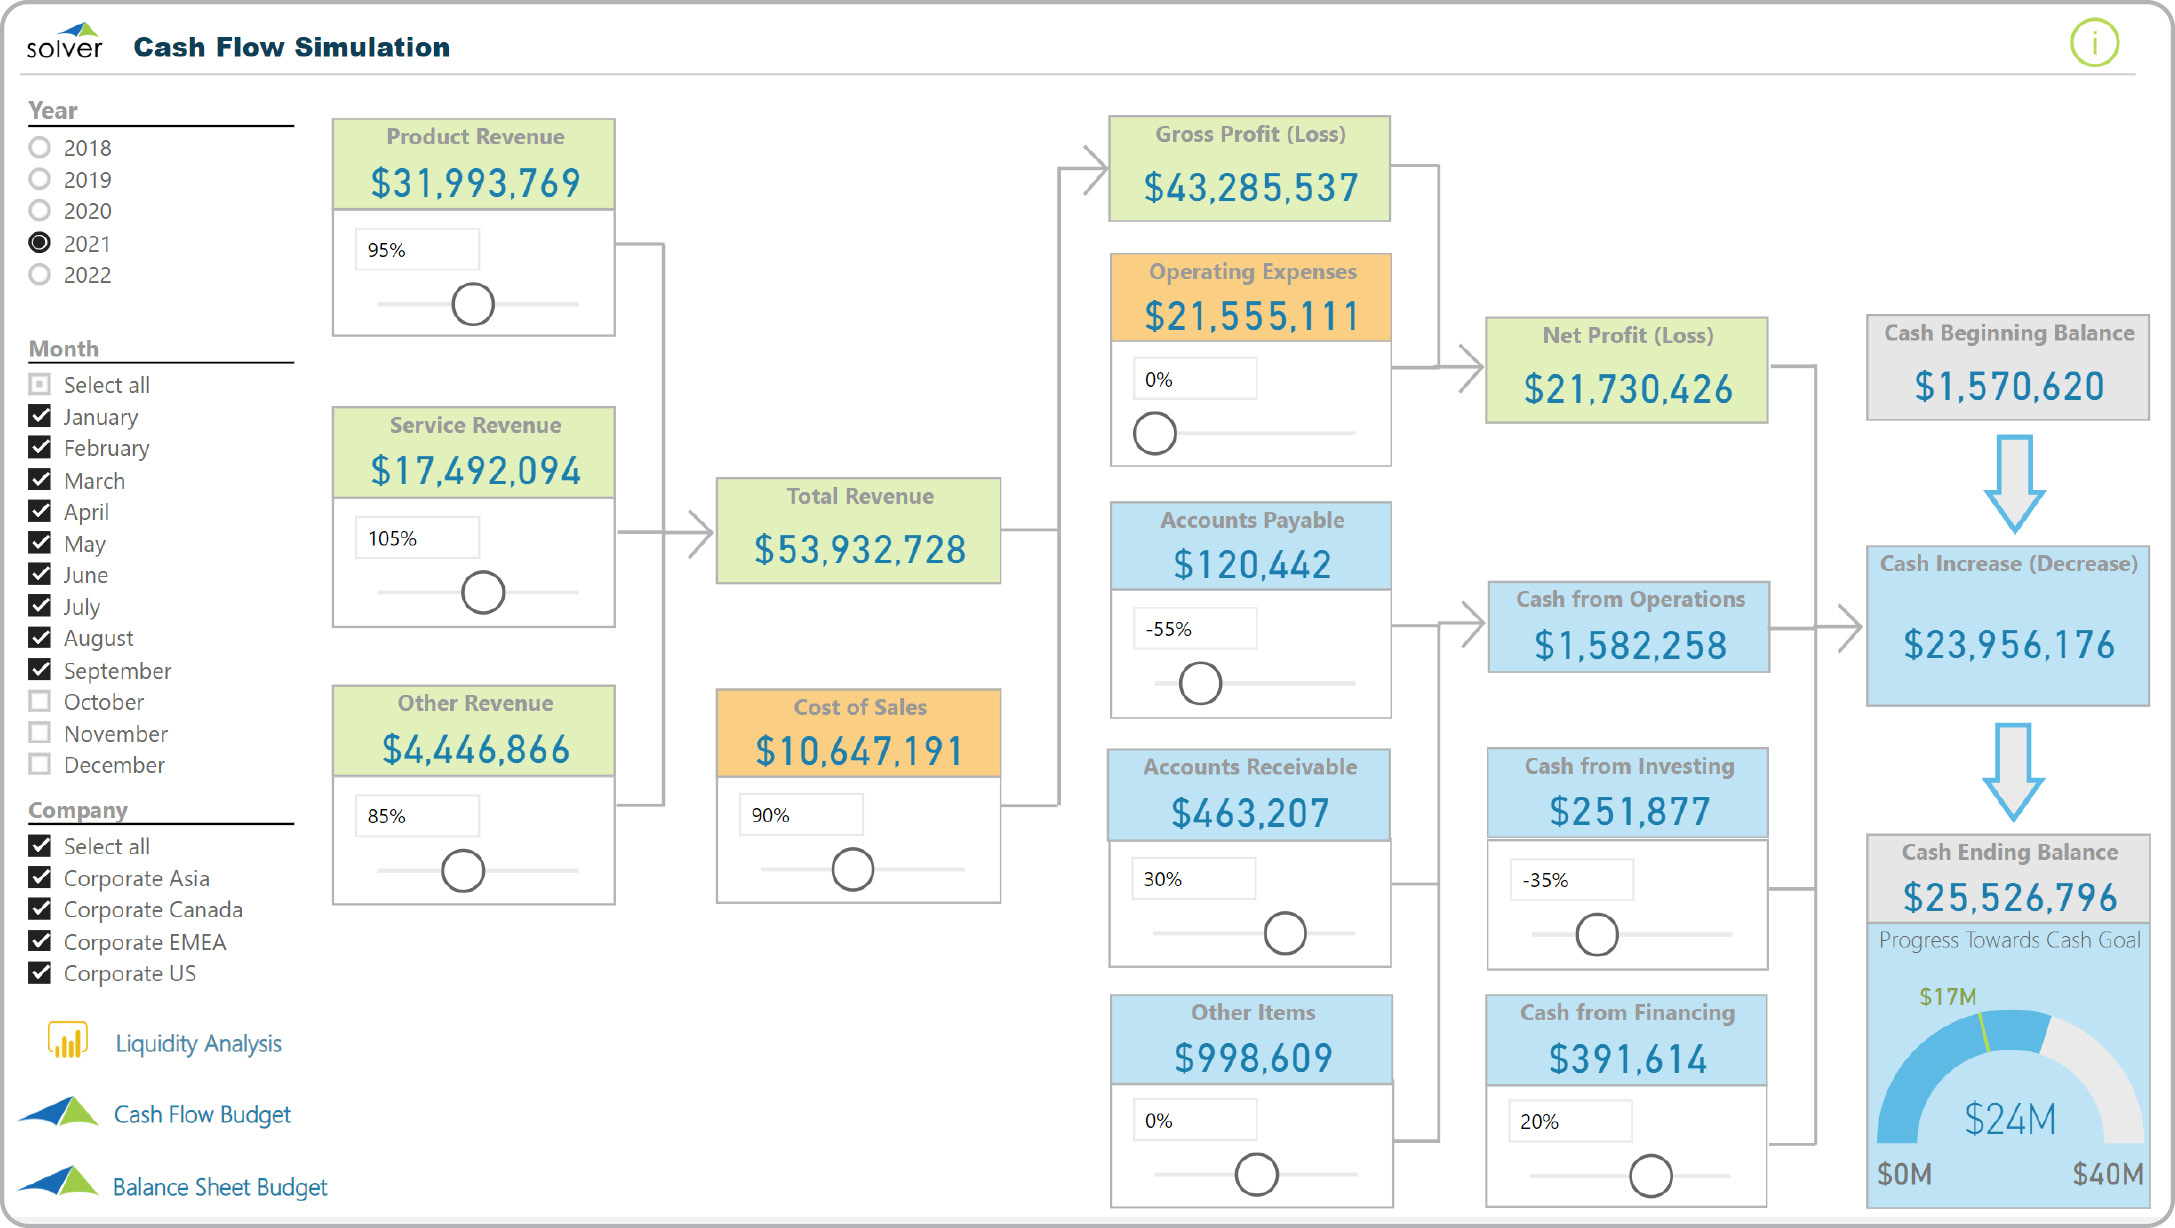
What is a Cash Flow Simulation Dashboard? Cash Flow simulations are considered liquidity planning tools and are often used by CFOs and controllers to plan and predict the company's cash flow. Key functionality in this type of dashboard includes complete interactivity with a slider for each component on the screen that a user can move to increase or decrease that metric to instantly see how that affects the total cash flow shown on the right side of the screen. The simulation displays an increase or decrease in cash balance which is then added to the beginning cash balance to provide the ending cash balance (lower right hand corner of the screen). Once the simulation has been completed, the user clicks the links in the lower left corner of the screen to open the balance sheet and cash flow budget input forms where adjustments are made to come up with a new budget or forecast scenario. You will find an example of this type of dashboard below.
Purpose of Cash Flow Simulations Companies and organizations use Cash Flow Simulations to quickly and easily perform what-if scenarios that result in increases or decreases in cash flow. When used as part of good business practices in a Financial Planning & Analysis (FP&A) department, a company can improve its liquidity, as well as, reduce the chances that a lack of scenario planning results in cash flow issues.
Who Uses This Type of Dashboard? The typical users of this type of dashboard are: CFOs and financial managers. Other Dashboards Often Used in Conjunction with Cash Flow Simulations Progressive Financial Planning & Analysis (FP&A) Departments sometimes use several different Cash Flow Simulations, along with budget input models for profit & loss, balance sheet, cash flow and other management and control tools.
Where Does the Data for Analysis Originate From? The Actual (historical transactions) data typically comes from enterprise resource planning (ERP) systems like: Microsoft Dynamics 365 (D365) Finance, Microsoft Dynamics 365 Business Central (D365 BC), Microsoft Dynamics AX, Microsoft Dynamics NAV, Microsoft Dynamics GP, Microsoft Dynamics SL, Sage Intacct, Sage 100, Sage 300, Sage 500, Sage X3, SAP Business One, SAP ByDesign, Acumatica, Netsuite and others. In analyses where budgets or forecasts are used, the planning data most often originates from in-house Excel spreadsheet models or from professional xFP&A solutions.
This Solver report template connects directly to your ERP data via the Solver Data Warehouse, enabling near real-time analysis with minimal setup. Designed for QuickStart deployment, it can be activated rapidly so your team can focus on analysis and decisions — not data preparation.
What is the Cash Flow Simulation in Solver? The Cash Flow Simulation is a pre-built xFP&A report template in Solver that delivers key financial and operational metrics in a single, easy-to-use interface, eliminating the need for manual data work or custom report development.
Who uses this Solver report template? CFOs, FP&A managers, and controllers use this report template to support month-end close, variance analysis, and management reporting. It is designed to be self-service and require no custom development.
Where does the data come from? Data is sourced automatically from your ERP system through the Solver Data Warehouse, which integrates with platforms such as Microsoft Dynamics 365 Business Central, Dynamics 365 Finance, Acumatica, Sage Intacct, and other leading ERP solutions. Once connected, the template updates in near real-time with no manual data entry required.
To learn more, visit the Resource Library.