Top Excel Features to Look for in the Best Planning and Financial Reporting Software Apps

    This article is part 3 of an 8-part series on evaluating the best CPM tools for your business. Part 3 focuses on Excel functionalities that strengthen the best planning and financial reporting software applications.   Almost every financial professional both loves and hates Microsoft Excel. It seems like we can’t live with it and we can’t live without it! So, when you are looking to acquire a new financial reporting or planning solution and you are comparing your vendor finalists, how well each solution interacts with Excel tends to be part of the top user requirements. It should be noted that while an increasing number of cloud solutions emerged between 2010 and 2015, the popular sentiment from the browser-based vendors was that their tools would completely get rid of Excel. But, in short order, their customers started to miss the formatting and calculation power of Excel (as well as its familiarity) when they were creating reports and budget models. As a result, the early cloud vendors added Excel add-ins to provide an alternative design experience for Excel fans, and several newer vendors such as Vena and Solver made Excel an integral part of their cloud solutions. For most companies, Excel functionality is THE key to success when using the best planning and financial reporting software. Here are some of the top features to look for in reporting and budgeting Excel add-ins Most finance, accounting, and budgeting users would consider strong Excel integration to be one of the top 5 or top 10 features when evaluating and comparing planning and reporting vendors. Below, we will discuss some important features to consider in this regard.
    1. The difference between Excel export/import and Excel add-ins
    While pretty much every reporting, planning, and corporate performance management (CPM) solution can import data from and export reports to Excel, these processes should not be confused with Excel add-ins, which are plugins to Microsoft Excel that appear on its ribbon. With an Excel add-in design tool, users build dynamic, parameter-driven reports that pull data from the ERP or CPM database. Data can be refreshed and written back (budgeting and forecasting) without any type of export and import process, which provides self-service for end users. On this page you can find hundreds of examples of reports and budgeting forms built with an Excel add-in and made to run in a browser. Reviewing vendor examples of the types of templates you want to build with your new solution can be a very good assurance that the design and layout capability in your chosen solution is going to take care of your organization’s needs.
    1. Examples of pure Excel tools versus web portals with Excel add-ins
    In the past, Excel add-ins were stand-alone reporting tools that needed to be installed on every user’s desktop (or virtual machine). So, if you had 50 users your IT department would be maintaining and upgrading 50 Excel add-ins. Luckily, this has changed. Since cloud architectures emerged in the CPM market, almost all vendors have built multi-tenant web portals that are managed and automatically upgraded by the vendor. Today, there are still a few of the classic Excel add-ins left and most have the ability to connect to cloud ERPs and “trickle” the data to Excel when reports are processed. All major vendors, however, have web portals where reports are stored and, in some cases, also executed in the user’s browser without requiring Excel to run them. This architecture is particularly useful for planning processes where a significant number of end users can simply open their browsers and enter budgets and forecasts that are stored directly in the CPM solution’s cloud database.
    1. The importance of dynamic Excel rows and columns versus static ones
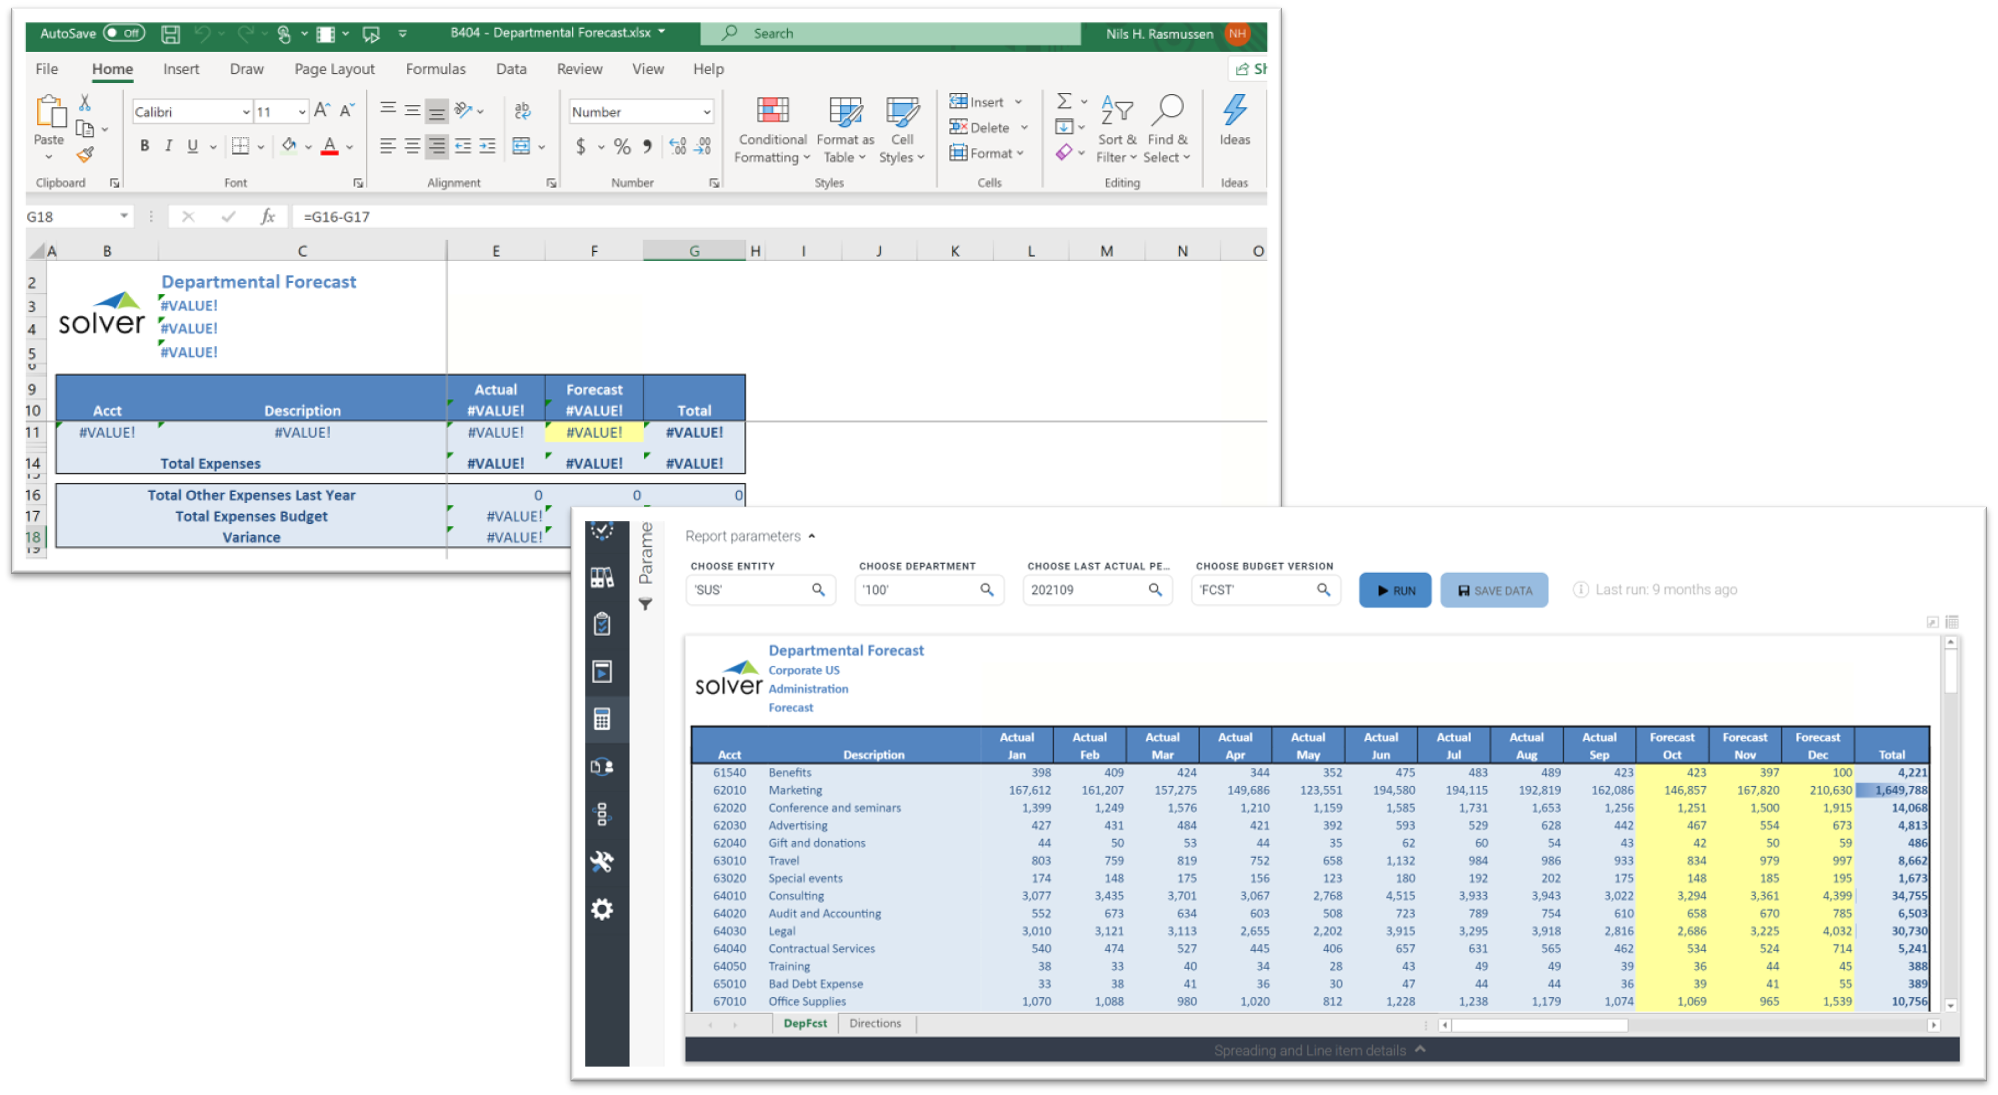
    Most organizations add accounts, departments, and other dimension members to their ERP during the year. For older Excel add-ins, this usually requires manual maintenance of reports and budget templates in order to insert new rows or columns, or to maintain the content of dropdowns for parameters (e.g., a list of departments). This is because these add-ins can only put formula references at the cell-level in the spreadsheet. With modern Excel add-ins, you can have dynamic listing of rows or columns and global report parameters. Here are some quick examples:
    • Dynamic rows
    If you have, for example, 20 Operating Expense accounts, you can create a range formula on a single row in Excel that automatically expands out to 20 rows. If someone adds 1 new account number in that range, you automatically get 21 rows in the report (or budget form). In older Excel add-ins, you have to manually create each row and, since they are static, new accounts will not become new rows automatically.
    • Dynamic columns
    Let’s say you want actual data from January up to the current month and a forecast from next month through December. In a modern Excel add-in this report can be done dynamically, regardless of which month you run it for. With static, legacy Excel add-ins, you will need to manually change the formulas each month, make 11 versions of the report, or do major “tricks” in the report to make it more dynamic.
    Template design with dynamic rows and dynamic columns

    Template design with dynamic rows and dynamic columns

    • Dynamic global parameters
    Typical examples of these are report filters for company, department, period, or budget version. In legacy Excel add-ins, these are designed as regular Excel dropdown boxes that populate based on data (e.g., a list of months or departments) hidden somewhere in the workbook. In modern Excel add-ins, these parameter selectors are dropdowns on a side menu or in the Excel sheet that pulls their content directly from the database. In other words, they are always fresh and don’t need hidden dimension lists in each report or budget template. In summary, modern Excel add-ins with dynamic rows, columns, and global parameters provide quicker report design and less maintenance work. They are also less likely to produce wrong reports because they can automatically include new accounts and other ERP dimension members that tend to change.
    1. Is Excel the primary design tool or an additional solution to learn?
    Finance and accounting people tend to be very busy and few like to spend more time than necessary to build or maintain reports. As we discussed earlier, this is a major reason that Excel add-ins are so popular and have returned as part of cloud CPM solutions. However, when you compare vendors with Excel-based report designers, it is important to research whether their Excel tool is their second (“optional”) report writer or THE report writer. Cloud solutions where there is a proprietary web designer, plus an optional Excel designer, result in users having to not only learn two tools but also having to constantly deal with decisions regarding whether a new report should be built in Excel or in the proprietary browser tool. Making a monthly package of reports from both tools, if possible, can be messy and lead to too much manual effort. Solutions with a single, purpose-built Excel designer have the advantage of delivering one single tool to learn for users, and packaging and distributing reports can all be done in one place.
    1. Built for cloud
    While some legacy Excel add-ins are still pure on-premises tools, most can now connect to cloud ERPs. The latest generation of Excel add-ins can not only be managed (installation, user security, etc.) from cloud portals, but some, like Solver, can even “convert” templates automatically from Excel to web reports and input forms. In these tools, users can choose to run the same report as a web report without requiring an Excel add-in. Alternatively, they can use the Excel add-in to open the report in Excel and execute there. In other words, part of the research and comparison of the vendors’ reporting and budgeting solutions should be to find out if their planning and financial software relies on legacy tools or purpose-built cloud architectures. How much does a CPM solution with Excel-based reporting and planning cost? While it is important to do your homework to ensure that the vendor you choose has the key features needed for a successful deployment, your total cost and savings in time and effort matter – as does your improved capacity for better, faster decision-making at your company. Here are some factors to consider when you get prices from your vendor finalists:
    • Does the annual subscription from each vendor contain the same user count and modules?
    • If you are receiving a discount, how long until it resets to the list price?
    • Does the vendor have a written policy for annual price increases?
    • Are the implementation estimates from each vendor for exactly the same work?
    A good rule of thumb is to ask each vendor for the total subscription cost for the first 5 years. Make sure this includes any potential price increases. Also, if the vendor is owned by a private equity firm, chances are that they will be sold while you are still a customer, so you will want to ensure that you receive a document that states their policy for price increases in the future (including if they are sold to another company). Here is a free vendor comparison and return on investment (ROI) tool to help you compare vendors across a number of different features. This tool also includes a simple return on investment (ROI) calculator that is part of the total vendor score. Rapid deployment tools will also help speed up implementation while reducing risk and cost. Here is an example of the advantages of a pre-built ERP integration and how it can enable users to get immediate, “day one” benefits from out-of-the-box budget and forecast input forms, reports and dashboards. Conclusion In summary, choosing one of the best financial reporting software solutions to automate monthly reporting, as well as to cover other management reporting needs, will ultimately drive better and faster decision making at your company. This is why the task of finding the best planning and financial reporting tools is increasingly becoming a strategic priority for organizations across all industries. As we discussed earlier, certain features are more important than others in the evaluation process and can act as key drivers of success – in addition to a well-executed implementation process, of course. Links to useful software research and evaluation assets
    January 18, 2021