

View Favorites
Revenue Analysis - Monthly Actual and Budget Comparison
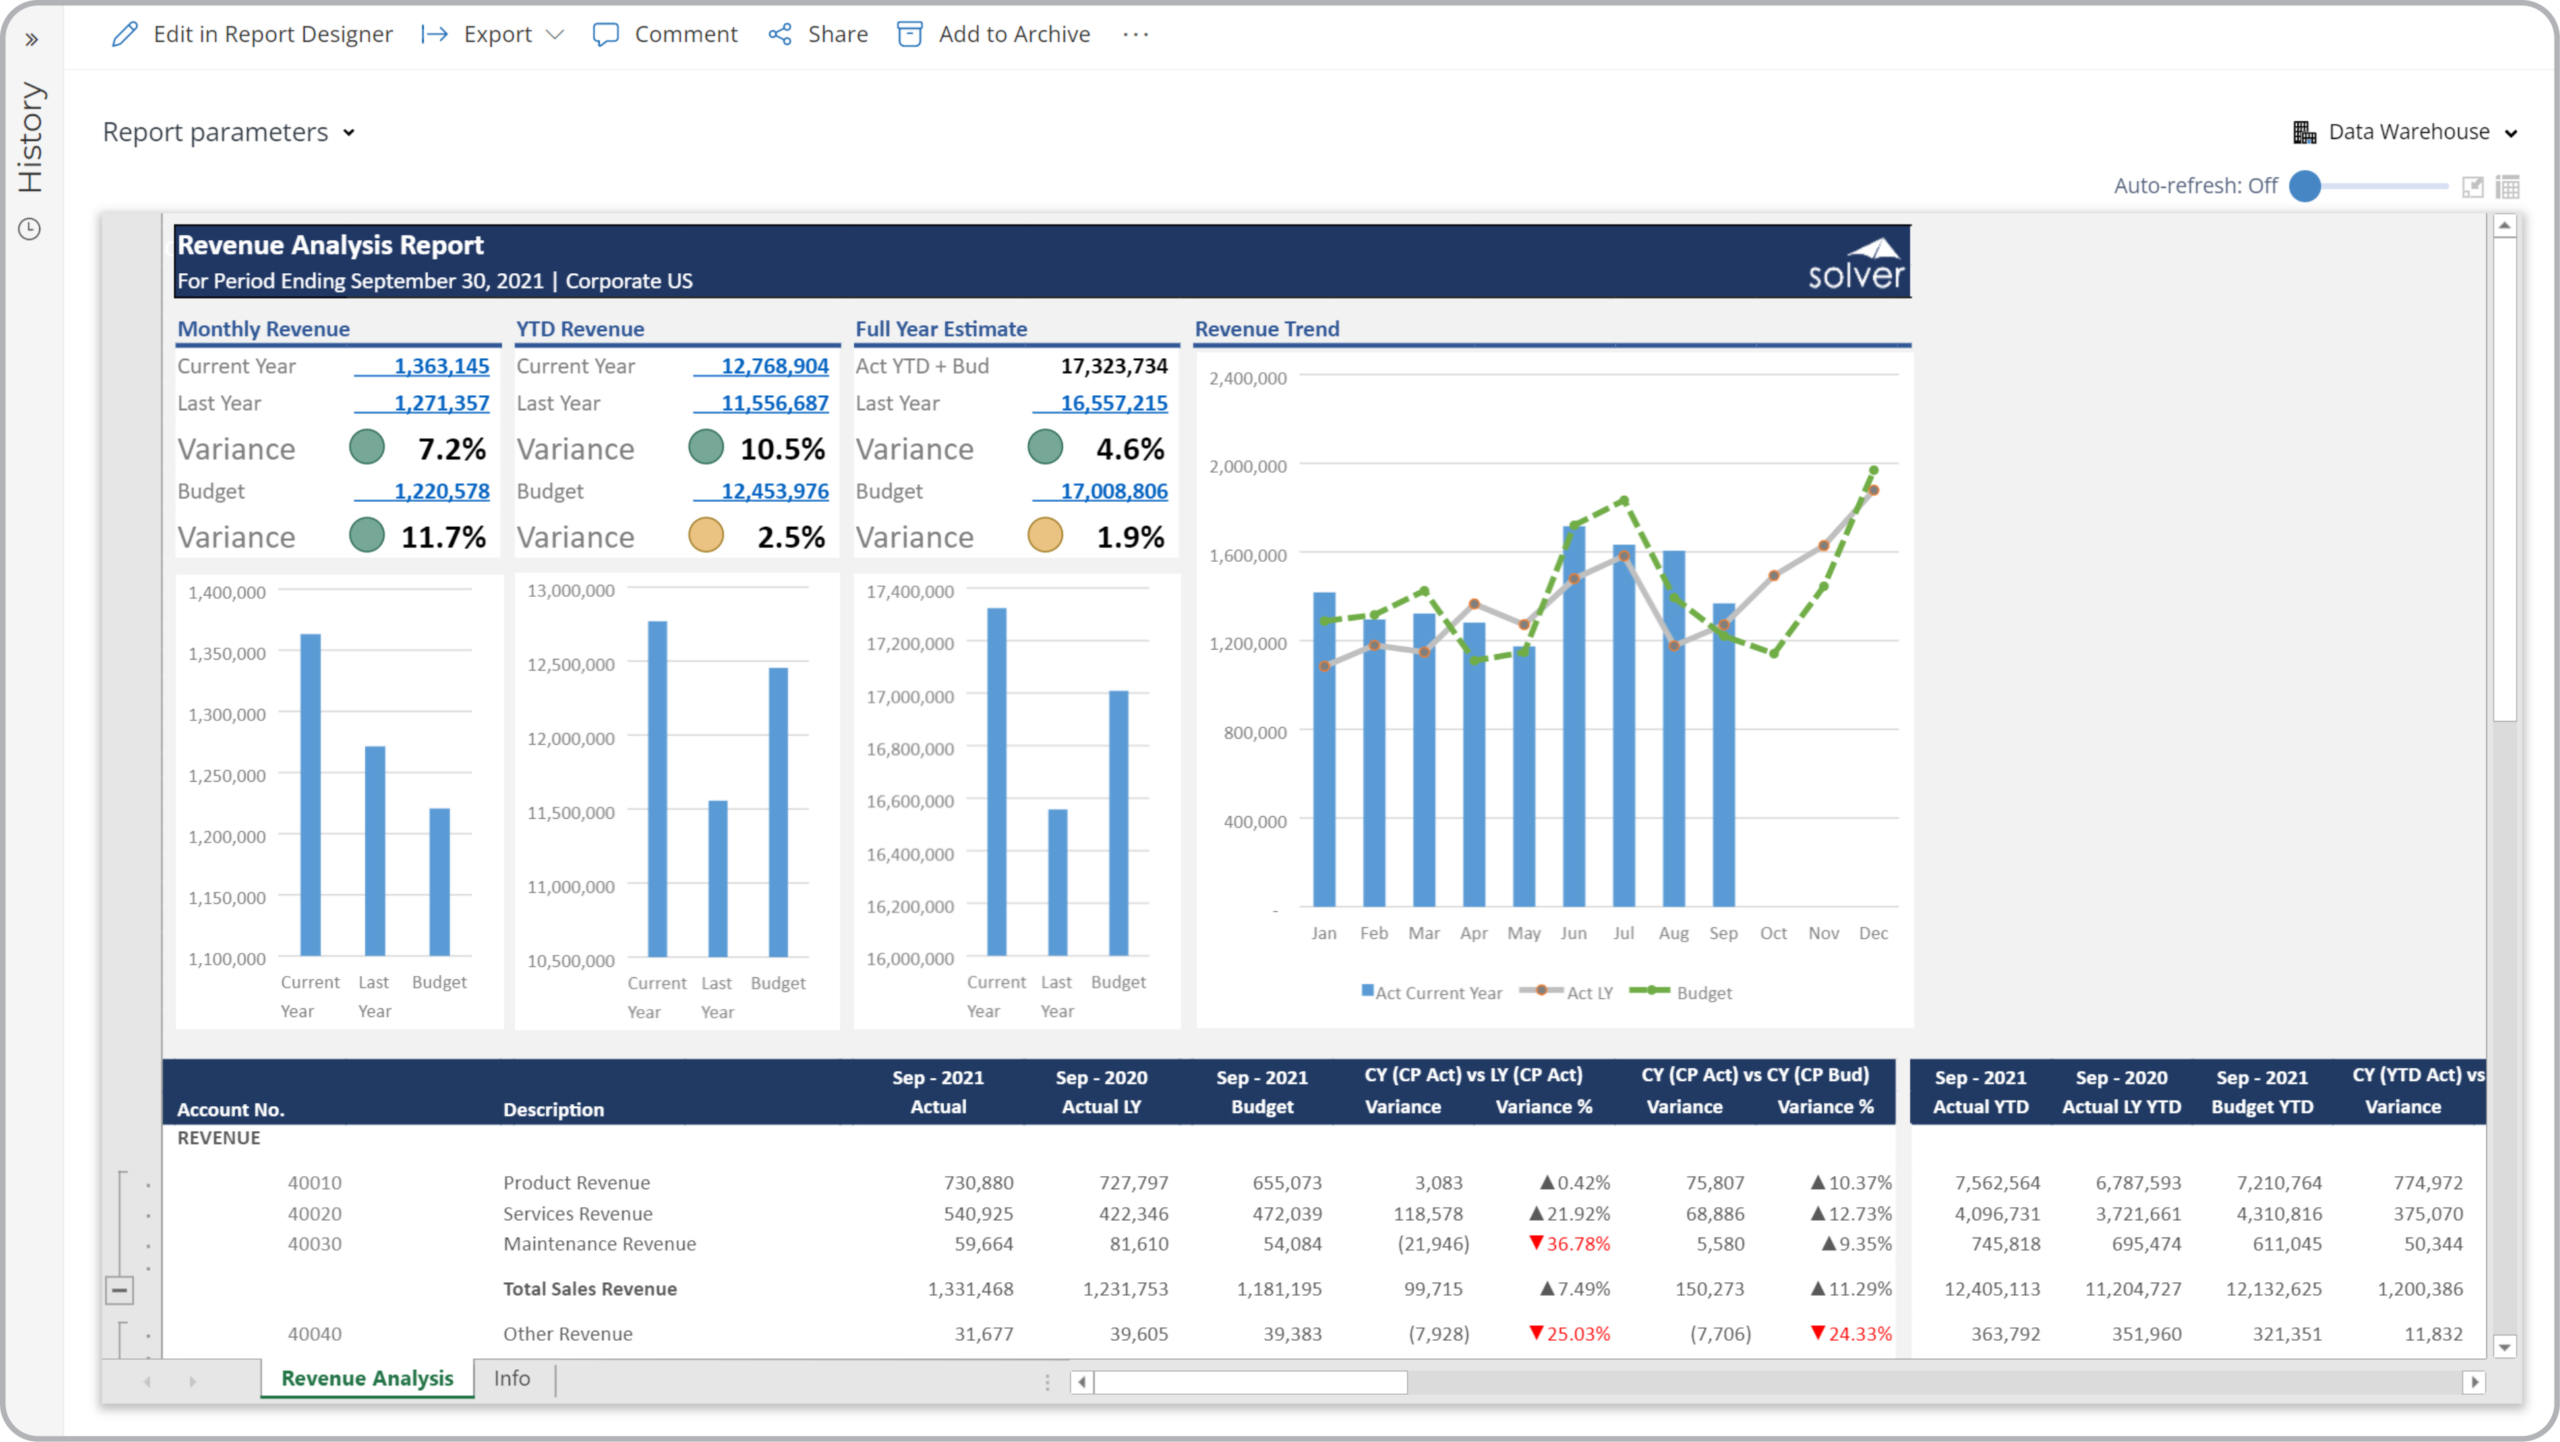
Graphical, monthly analysis of Revenue variances and trends
How can Graphical Revenue Analysis Drive Faster and Better Decisions? As CFOs increasingly become key innovators in the Monthly Reporting and Analysis Process, they must rely on modern self-service xFP&A and business intelligence (BI) tools. Using graphical reports like the Revenue Analysis with Monthly Actual and Budget Comparison template shown below enables them and users from the FP&A teams and the board to experience near real time monthly variance- and trend analysis that help drive faster and better decisions.
Who uses Revenue Analysis Reports with Monthly Actual and Budget Comparisons and What are Some Key Analytical Features? In today’s fast-paced business environment, CFOs are under high pressure to supply end users like executives and board members with timely and concise Revenue Analysis. Companies use key features like the ones below to support their users with effective reports that help drive better revenue analysis and faster decisions:
Data Integration to Transaction Systems Most organizations these days want automated and streamlined planning, reporting and analysis. However, many of the benefits described earlier rely on best of breed extended financial planning and analysis (xFP&A) tools and/or Business Intelligence (BI) capabilities as well as data marts or data warehouses that use pre-built integrations to the organization’s ERP system. Oftentimes, they also need integrations to other key data sources like CRM, subscription systems, payroll tools, etc. Modern, cloud-based ERPs like Microsoft Dynamics 365 Finance (D365 Finance), Microsoft Dynamics 365 Business Central (D365 BC), Sage Intacct, Acumatica, Netsuite and SAP have robust APIs which allow for dynamic integrations to xFP&A and BI tools that are fully automated and flexible to run on a schedule or on-demand.
Who uses Revenue Analysis Reports with Monthly Actual and Budget Comparisons and What are Some Key Analytical Features? In today’s fast-paced business environment, CFOs are under high pressure to supply end users like executives and board members with timely and concise Revenue Analysis. Companies use key features like the ones below to support their users with effective reports that help drive better revenue analysis and faster decisions:
- Monthly and YTD revenue totals with variances to budget and last year actuals with drill-down to account level detail in the report section at the bottom
- Automatically calculated full year revenue estimate
- Monthly trend and variance charts comparing actual current year with budget and last year figures
Data Integration to Transaction Systems Most organizations these days want automated and streamlined planning, reporting and analysis. However, many of the benefits described earlier rely on best of breed extended financial planning and analysis (xFP&A) tools and/or Business Intelligence (BI) capabilities as well as data marts or data warehouses that use pre-built integrations to the organization’s ERP system. Oftentimes, they also need integrations to other key data sources like CRM, subscription systems, payroll tools, etc. Modern, cloud-based ERPs like Microsoft Dynamics 365 Finance (D365 Finance), Microsoft Dynamics 365 Business Central (D365 BC), Sage Intacct, Acumatica, Netsuite and SAP have robust APIs which allow for dynamic integrations to xFP&A and BI tools that are fully automated and flexible to run on a schedule or on-demand.
View Favorites