

View Favorites
GL Dashboard – 48 Month Revenue Trend
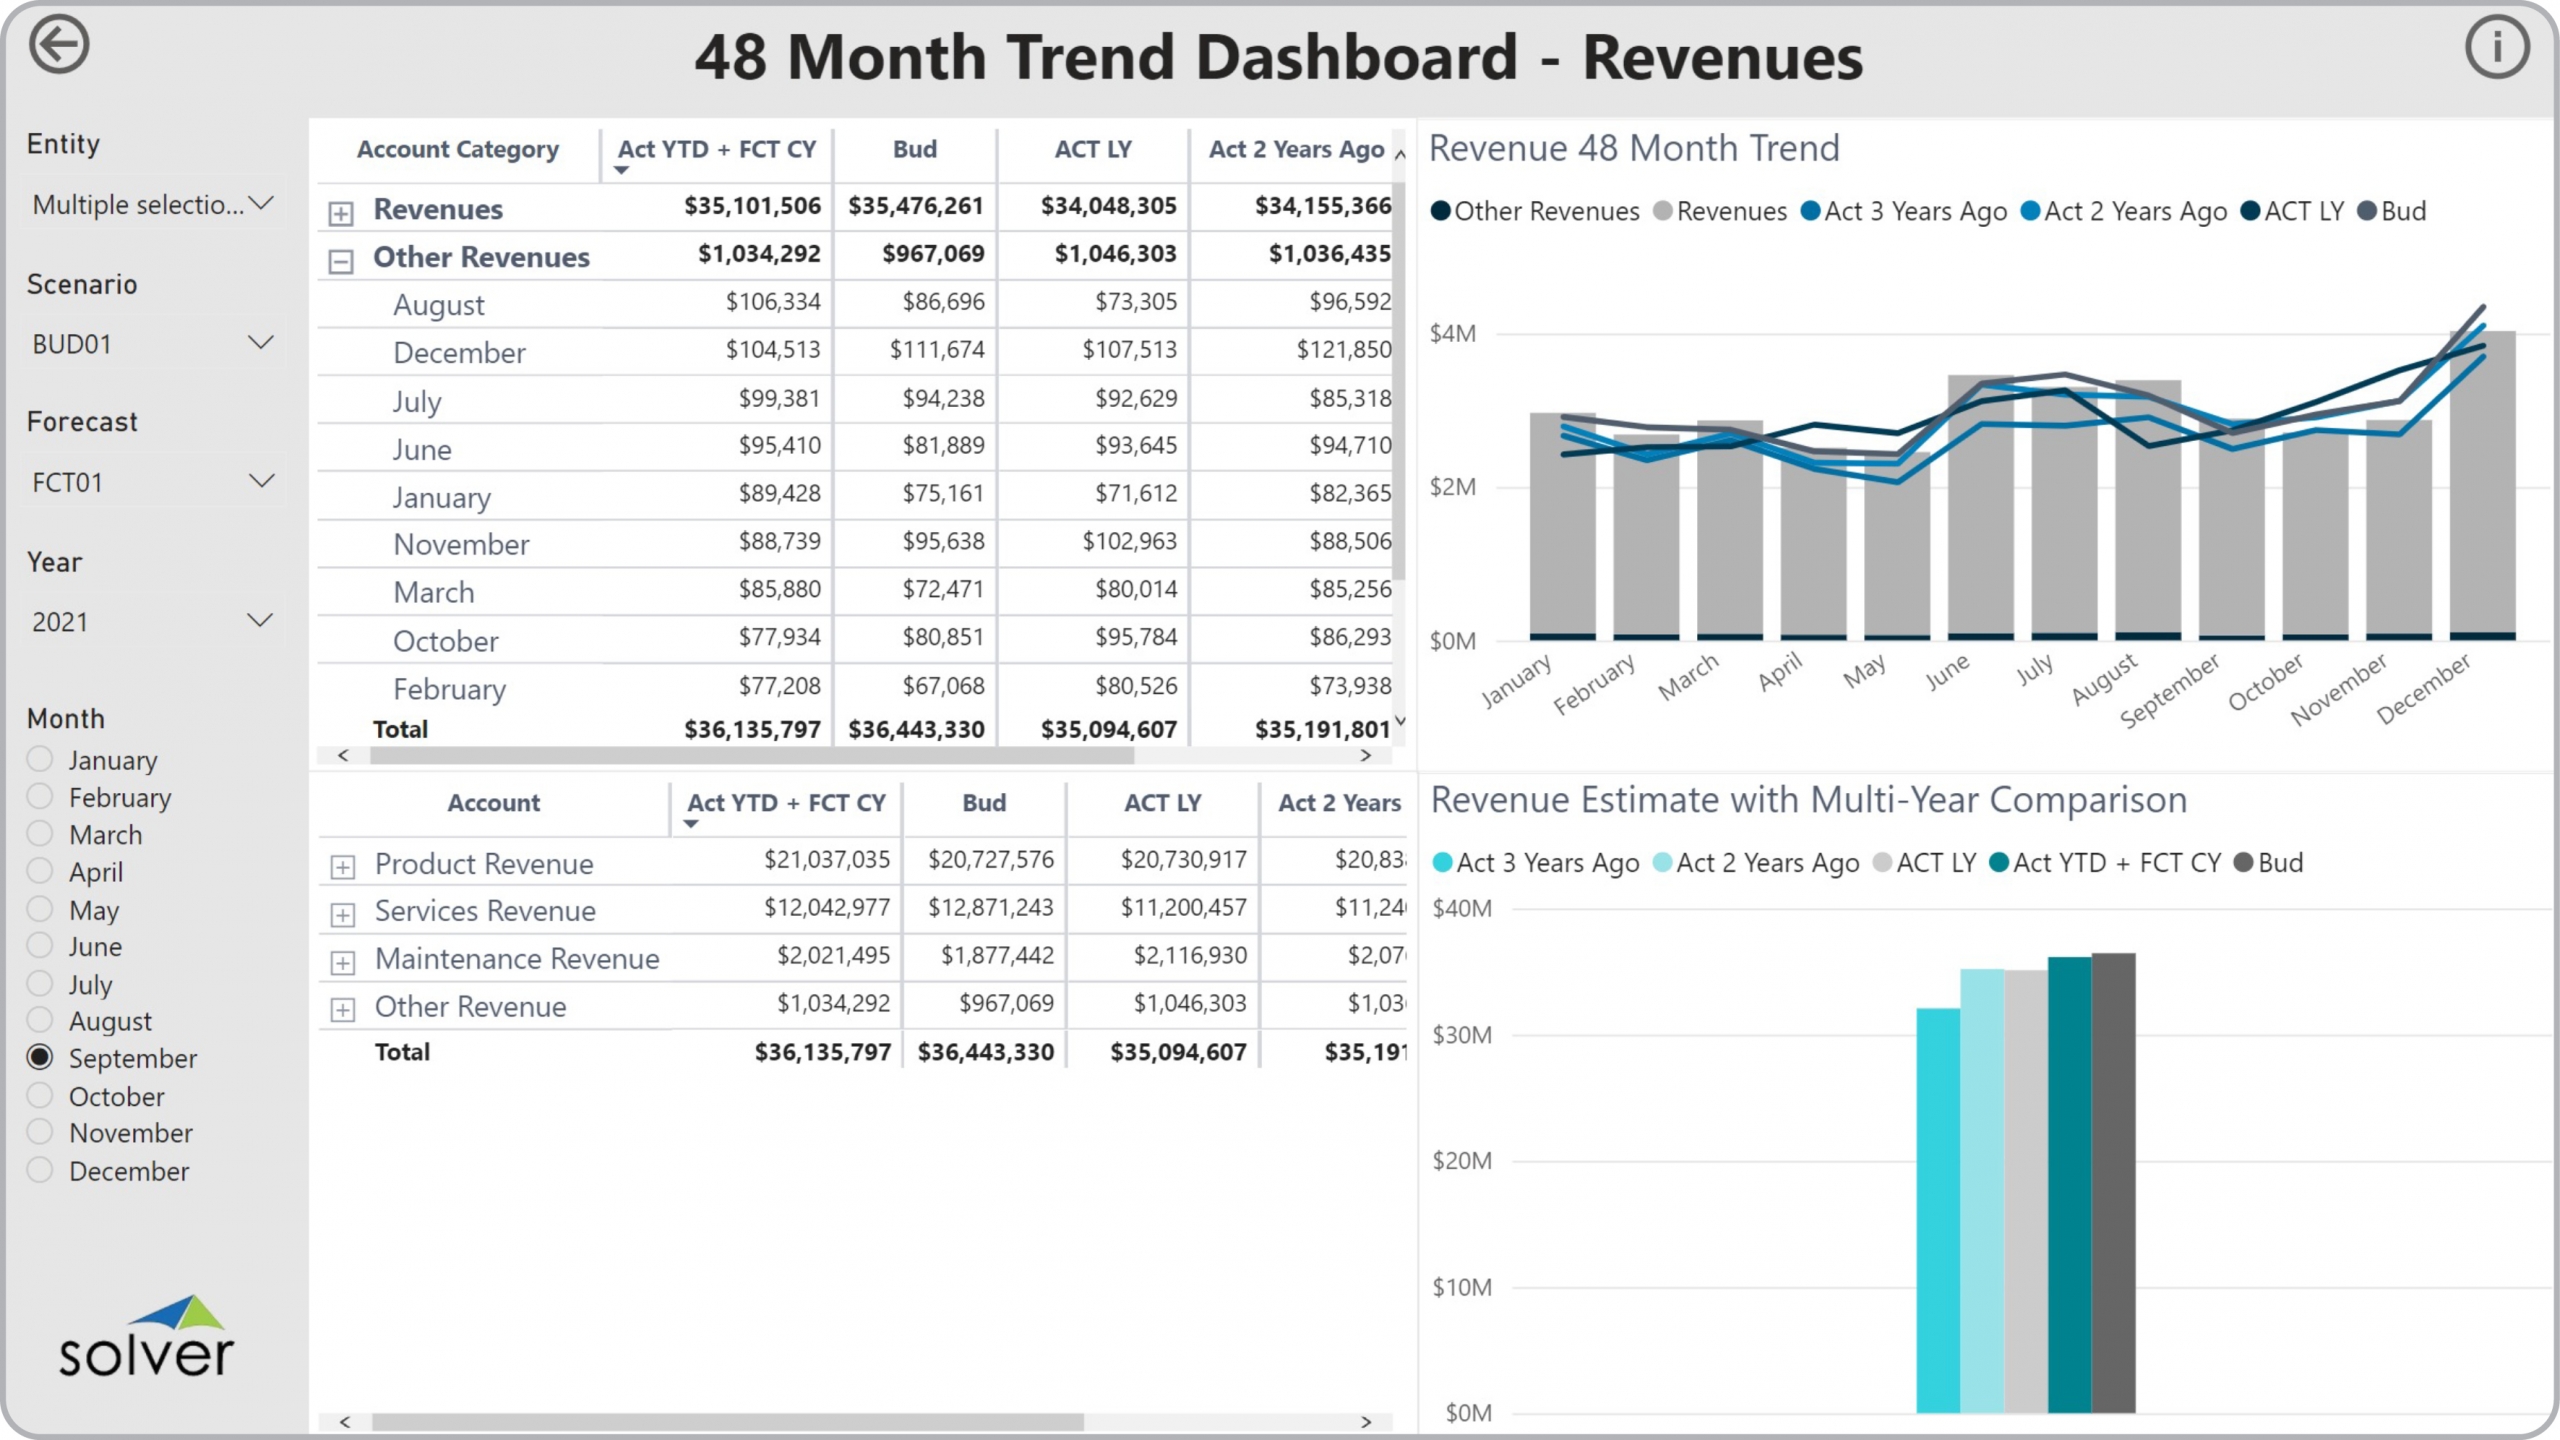
48 Month Revenue Trend Dashboards to Streamline the Monthly Reporting Process
How can Financial Dashboards Drive Faster and Better Decisions? As CFOs increasingly become key advisors in the Monthly Reporting Process, they must rely on modern self-service xFP&A and business intelligence (BI) tools. Using interactive Financial Dashboards like the 48 Month Revenue Trend Dashboard template shown below enables them and users from the executive team to experience near real time revenue trend analysis that help drive faster and better decisions.
Who uses 48 Month Revenue Trend Dashboards and What are Some Key Analytical Features? In today’s fast-paced business environment, CFOs are under high pressure to supply end users like senior leaders and board members with timely and concise Financial Dashboards. Companies use key features like the ones below to support their users with effective analysis that helps drive improved sales and liquidity planning:
Data Integration to Transaction Systems Most organizations these days want automated and streamlined planning, reporting and analysis. However, many of the benefits described earlier rely on best of breed extended financial planning and analysis (xFP&A) tools and/or Business Intelligence (BI) capabilities as well as data marts or data warehouses that use pre-built integrations to the organization’s ERP system. Oftentimes, they also need integrations to other key data sources like CRM, subscription systems, payroll tools, etc. Modern, cloud-based ERPs like Microsoft Dynamics 365 Finance (D365 Finance), Microsoft Dynamics 365 Business Central (D365 BC), Sage Intacct, Acumatica, Netsuite and SAP have robust APIs which allow for dynamic integrations to xFP&A and BI tools that are fully automated and flexible to run on a schedule or on-demand.
Who uses 48 Month Revenue Trend Dashboards and What are Some Key Analytical Features? In today’s fast-paced business environment, CFOs are under high pressure to supply end users like senior leaders and board members with timely and concise Financial Dashboards. Companies use key features like the ones below to support their users with effective analysis that helps drive improved sales and liquidity planning:
- Trend analysis with four years of actual data as well as current year budget
- Ranking by revenue account and category
- Variance analysis with multi-year history and budgets
Data Integration to Transaction Systems Most organizations these days want automated and streamlined planning, reporting and analysis. However, many of the benefits described earlier rely on best of breed extended financial planning and analysis (xFP&A) tools and/or Business Intelligence (BI) capabilities as well as data marts or data warehouses that use pre-built integrations to the organization’s ERP system. Oftentimes, they also need integrations to other key data sources like CRM, subscription systems, payroll tools, etc. Modern, cloud-based ERPs like Microsoft Dynamics 365 Finance (D365 Finance), Microsoft Dynamics 365 Business Central (D365 BC), Sage Intacct, Acumatica, Netsuite and SAP have robust APIs which allow for dynamic integrations to xFP&A and BI tools that are fully automated and flexible to run on a schedule or on-demand.
View Favorites