

GL Dashboard – 24 Month KPI Trend
Who uses 24 Month KPI Trend Dashboards and What are Some Key Analytical Features? In today’s fast-paced business environment, CFOs are under high pressure to supply end users like board members and executives with timely and concise Financial Dashboards. Companies use key features like the ones below to support their users with effective analysis that helps drive better decisions to prepare for future risks and opportunities:
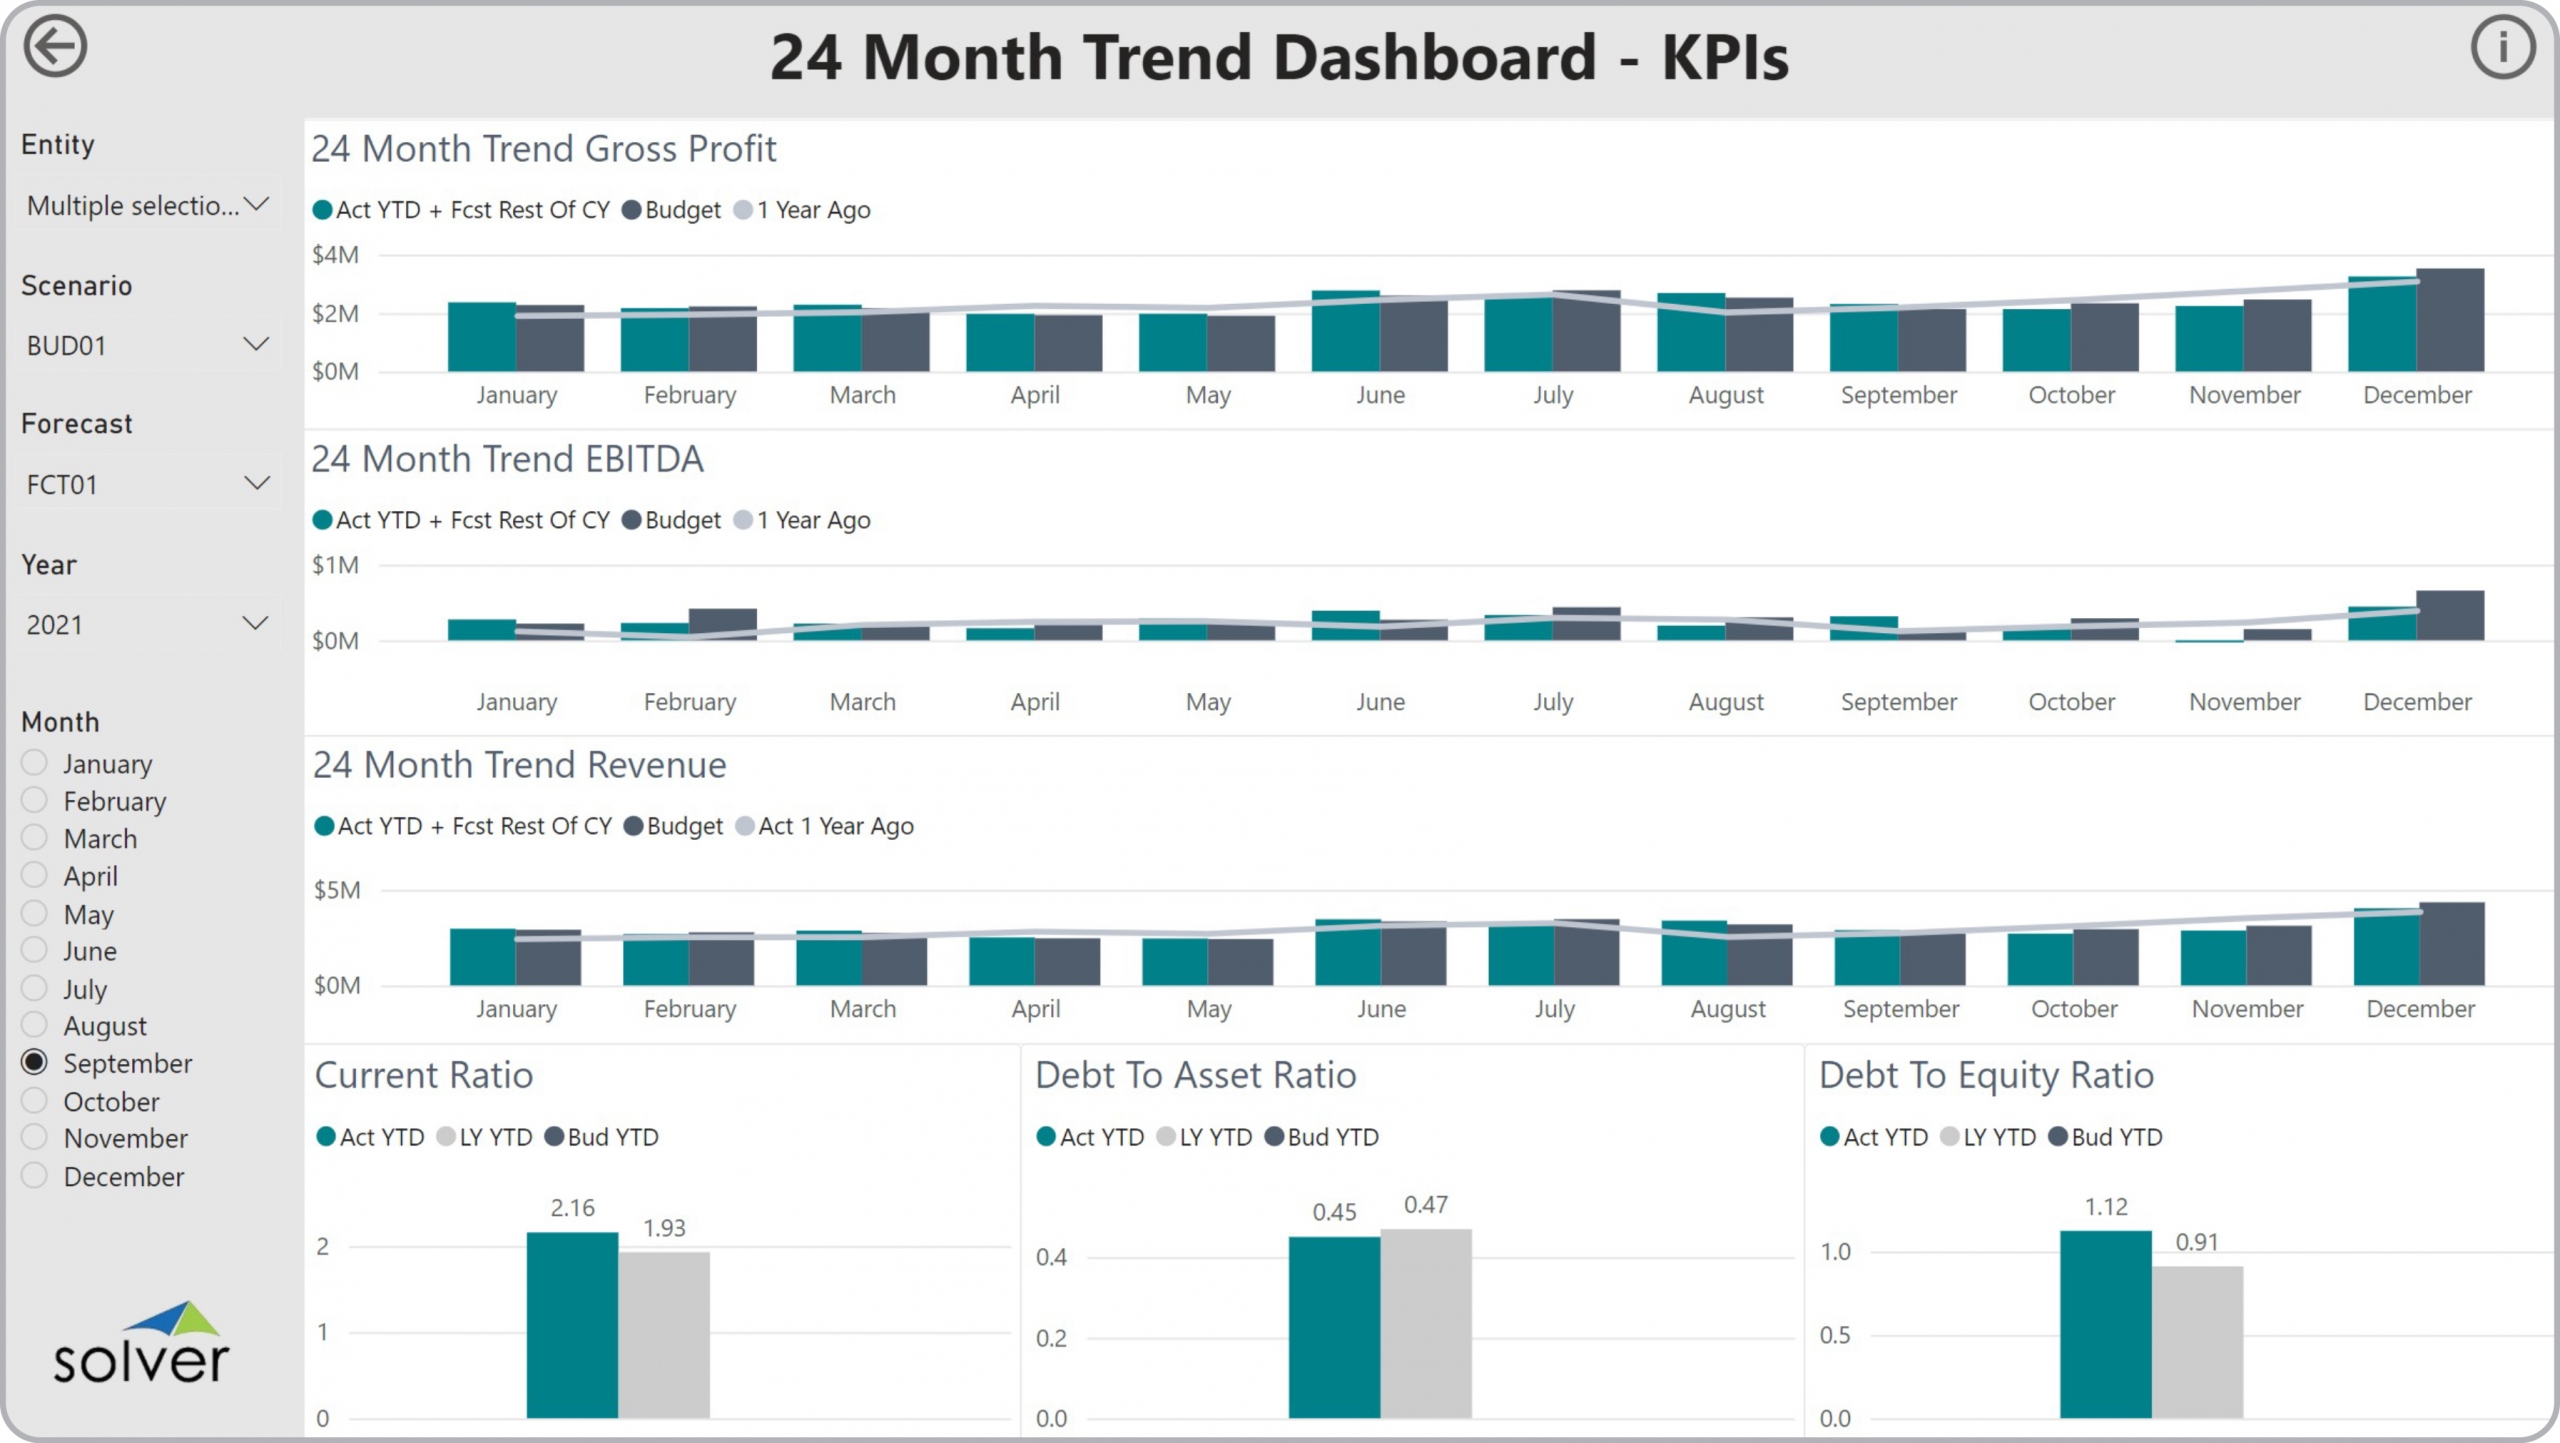
- Revenue and profit charts with auto generated estimate from actual year-to-date plus forecast (or budget) for the remaining months
- Comparison of two years of historical data
- Comparative analysis for Current Ratio, Debt to Asset Ratio and Debt to Equity Ratio
A Brief Description of the 24 Month KPI Trend Dashboard Template Financial Dashboards like the one seen in the image above are interactive and parameter driven and sometimes contain sections with revenue, profit and balance sheet ratio trend charts that include two years of history as well as budgets for the current year. One of the important features that aid the user in the analysis process is the ability to focus in on any business metric by changing the filters on the left side of the screen and expanding a chart to a full screen view. 24 Month KPI Trend Dashboards are often used in conjunction with profit & loss reports, balance sheet reports, variance dashboards, and forecast input models.
Data Integration to Transaction Systems Most organizations these days want automated and streamlined planning, reporting and analysis. However, many of the benefits described earlier rely on best of breed extended financial planning and analysis (xFP&A) tools and/or Business Intelligence (BI) capabilities as well as data marts or data warehouses that use pre-built integrations to the organization’s ERP system. Oftentimes, they also need integrations to other key data sources like CRM, subscription systems, payroll tools, etc. Modern, cloud-based ERPs like Microsoft Dynamics 365 Finance (D365 Finance), Microsoft Dynamics 365 Business Central (D365 BC), Sage Intacct, Acumatica, Netsuite and SAP have robust APIs which allow for dynamic integrations to xFP&A and BI tools that are fully automated and flexible to run on a schedule or on-demand.