

View Favorites
Credit Union – Balance Sheet
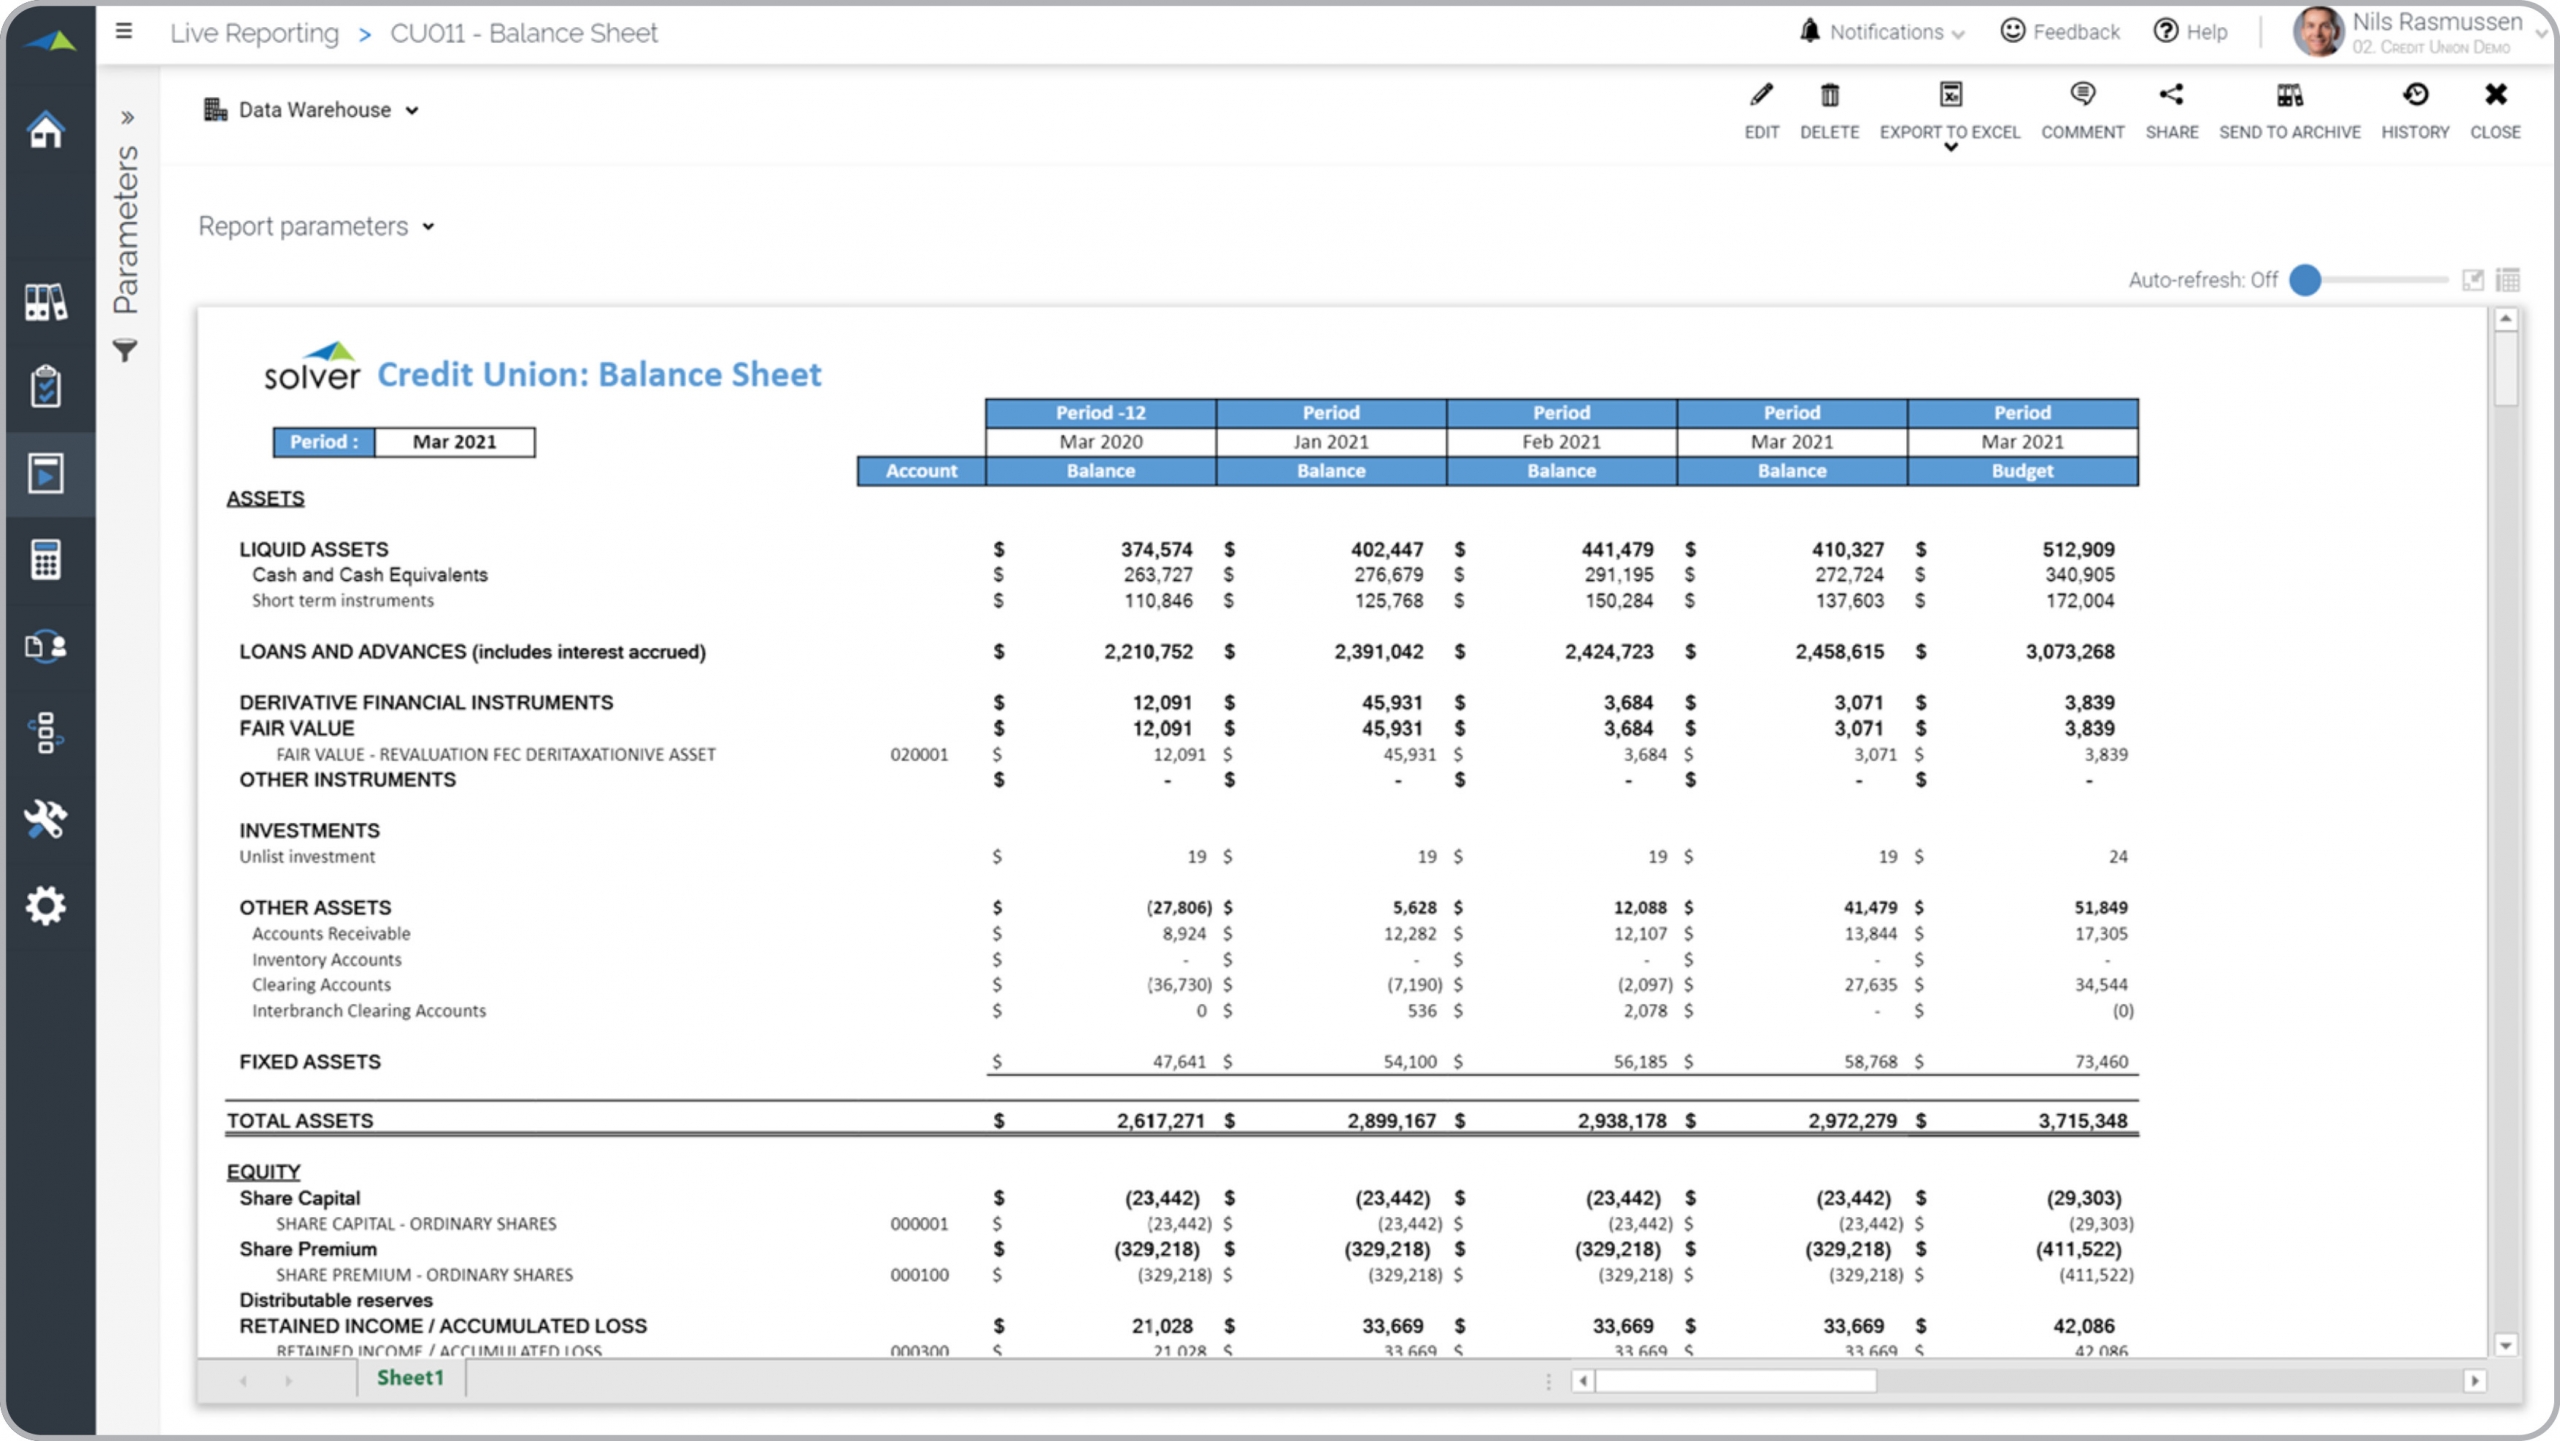
Financial statement that dynamically lists months up to the current period.
What is a Trended Balance Sheet? Trended Balance Sheets are considered analytical financial reports and are used by executives and CFOs to track monthly trends in assets, liabilities and equity. Some of the main functionality in this type of report is that it dynamically expands months across the columns based on the period you run the report for. The rows in the reports show a typical balance sheet layout with Assets, Liabilities and Equity sections and account balance details rolling up to sub-totals. The user can get further detail by drilling down on individual cells to see transaction-level information. You find an example of this type of report below.
Purpose of Trended Balance Sheet Reports Credit Unions use Trended Balance Sheet Reports to give executives the ability to see trends for both detailed and summarized views of assets and liabilities for each month up to the current period. When used as part of good business practices in Executive- and Financial Planning & Analysis (FP&A) departments, a company can improve its strategies and performance, and it can reduce the chances that leaders make poor decisions because they don't see if a figure is a trend or an outlier.
Who Uses This Type of Report? The typical users of this type of report are: Executives, Regional Managers, Branch Managers, CFOs, Analysts. Other Reports Often Used in Conjunction with Trended Balance Sheet Reports Progressive Executive- and Financial Planning & Analysis (FP&A) departments sometimes use several different Trended Balance Sheet Reports, along with income statement variance- and trend reports, cash flow statements, financial dashboards, KPI dashboards, budget models and other management and control tools.
Where Does the Data for Analysis Originate From? The Actual (historical transactions) data typically comes from enterprise resource planning (ERP) systems like: Microsoft Dynamics 365 (D365) Finance, Microsoft Dynamics 365 Business Central (D365 BC), Microsoft Dynamics AX, Microsoft Dynamics NAV, Microsoft Dynamics GP, Microsoft Dynamics SL, Sage Intacct, Sage 100, Sage 300, Sage 500, Sage X3, SAP Business One, SAP ByDesign, Acumatica, Netsuite and others. In analyses where budgets or forecasts are used, the planning data most often originates from in-house Excel spreadsheet models or from professional xFP&A solutions.
To learn more, visit the Resource Library.
View Favorites