

View Favorites
Bank – Securities Summary Portfolio
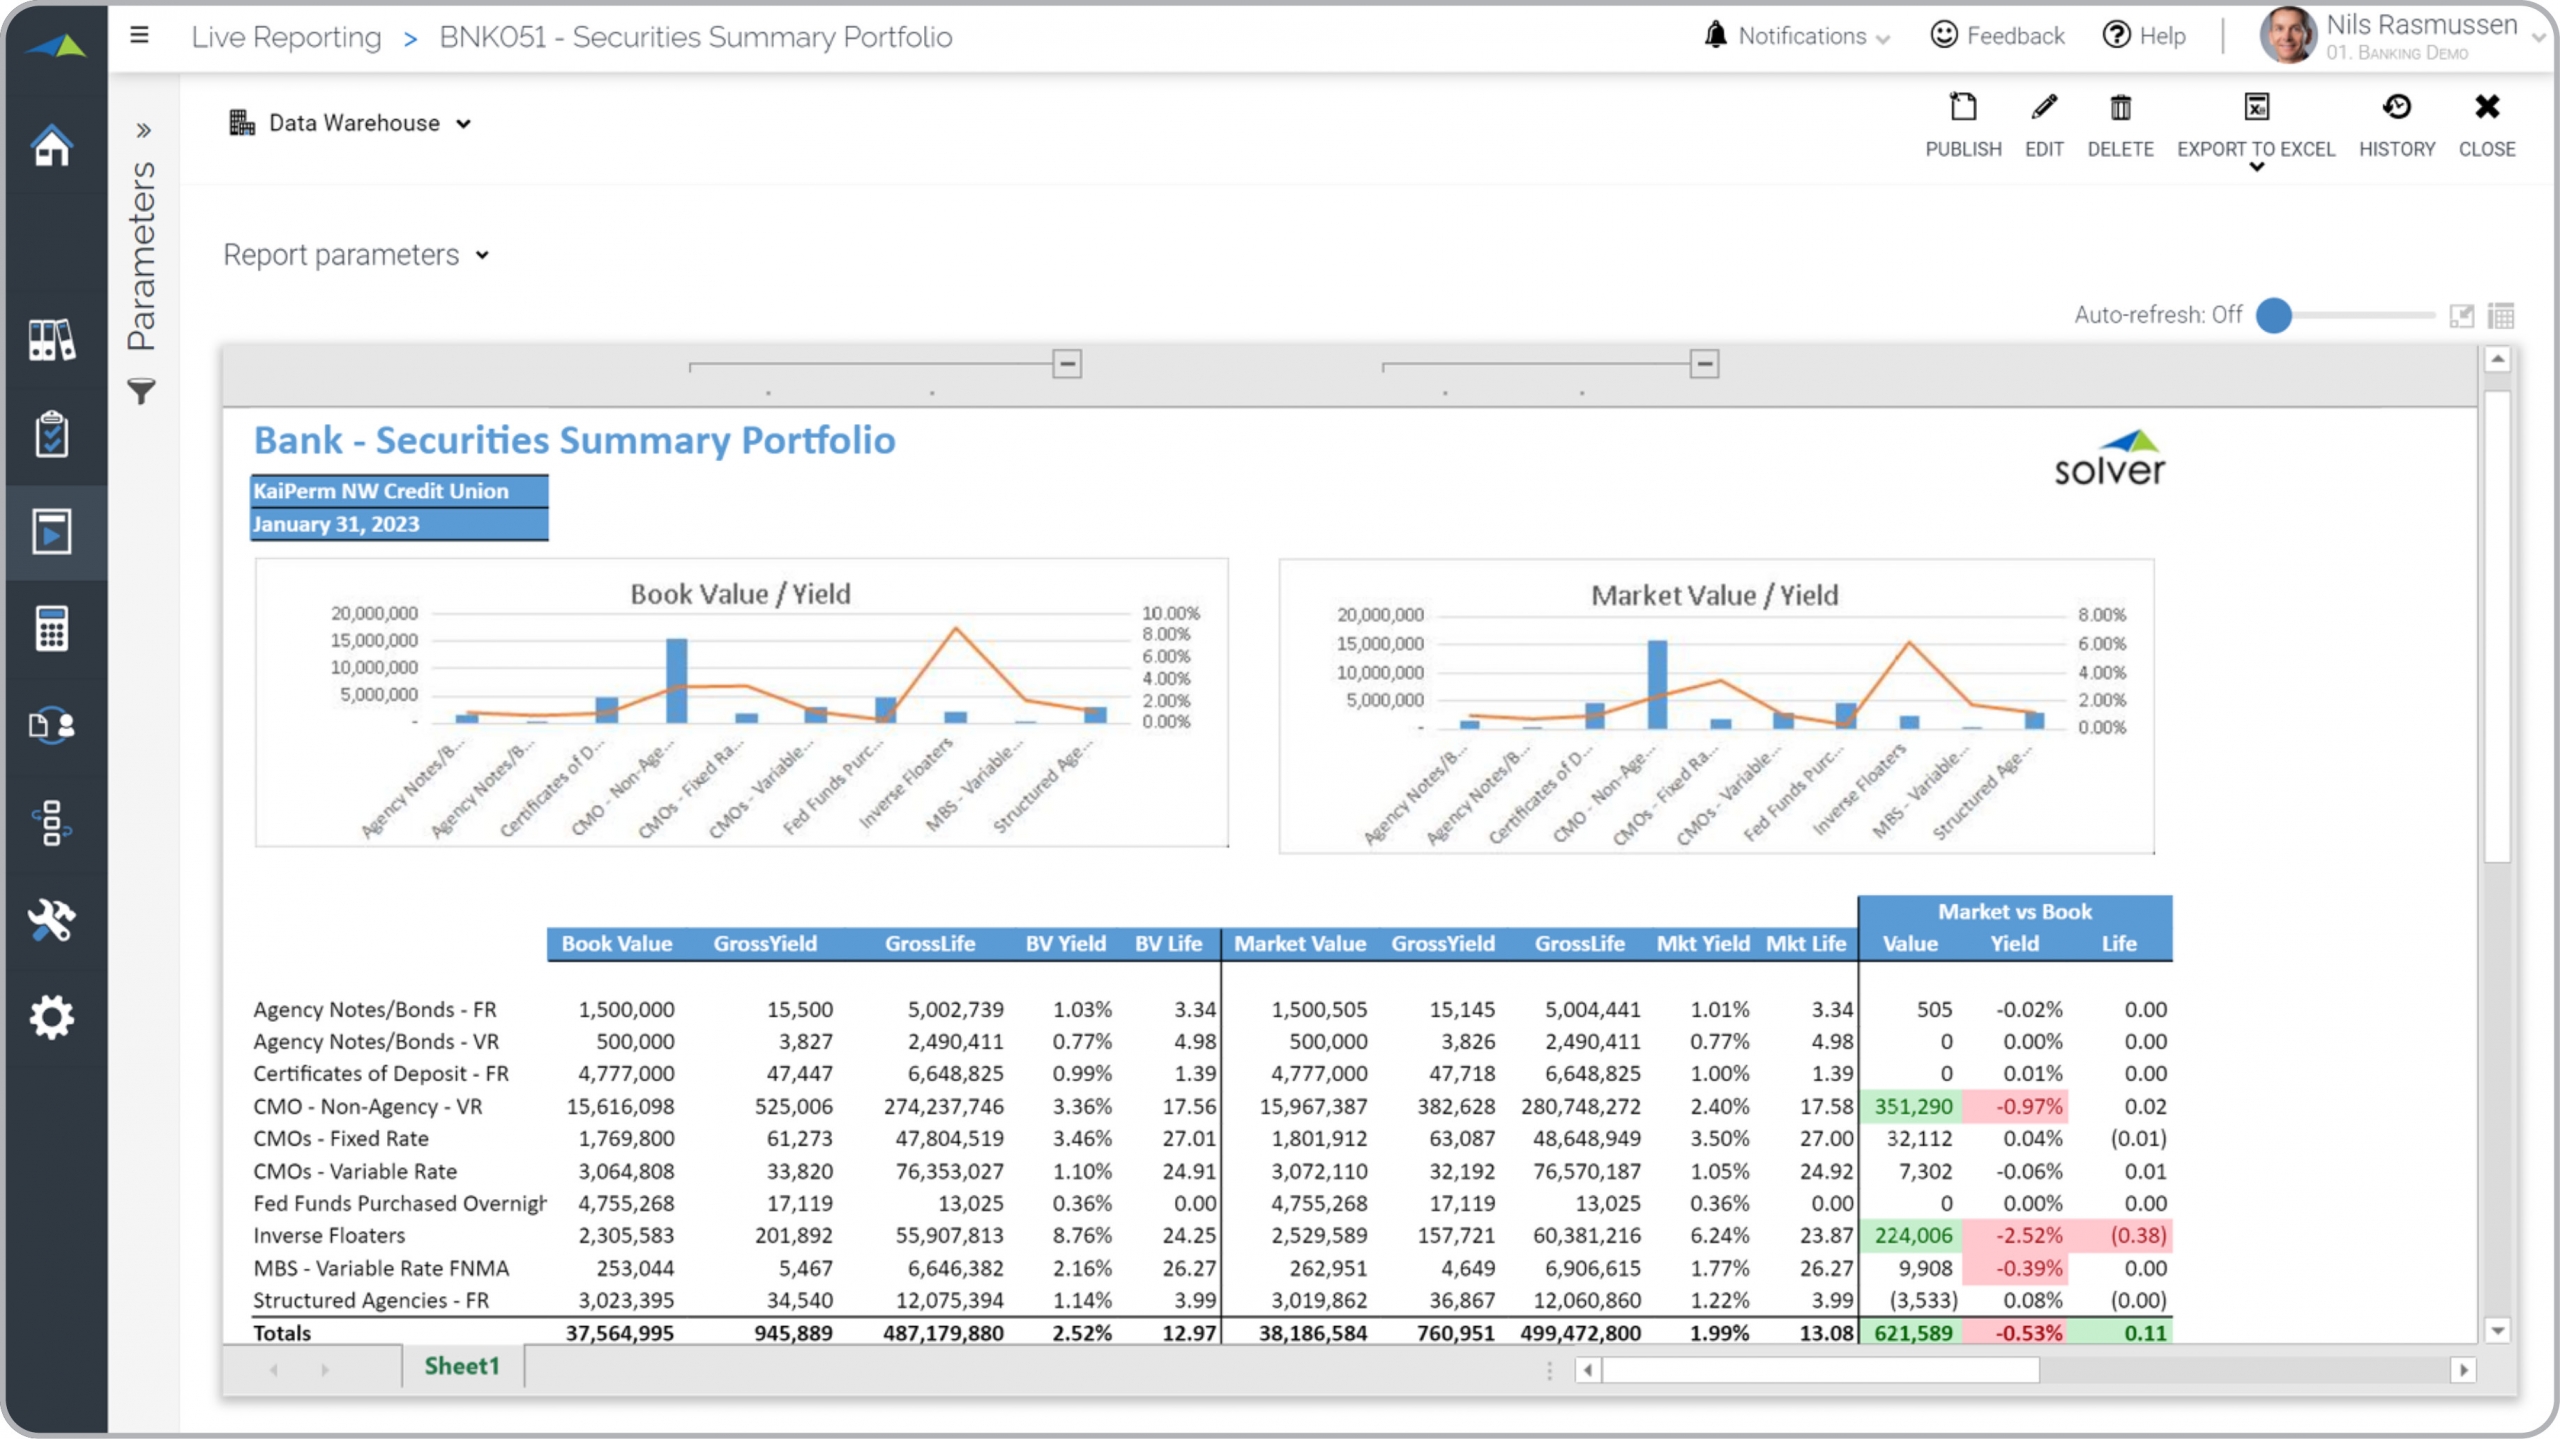
Overview and graphical analysis of the bank’s securities portfolio with yields, market value, etc.
What is a Securities Summary Portfolio Report for Banks? Securities Portfolio Reports are considered analysis tools and are used by investment managers and analysts to monitor the market- and book values of different securities. Some of the main functionality in this type of dashboard report is that it combines charts, figures and exception highlighting to optimize analysis. The top left chart shows book value of securities on the left axis and yield on the right axis. The top right chart shows market value of securities on the left axis and yield on the right axis. The body of the report lists securities down the rows. The columns include: Book value, Gross Yield, Gross Life, Book Value Yield, Book Value Life, Market Value, Gross Yield, Gross Life, Market Yield, Market Life, Market versus Book Value Variance, Yield Variance, and Life Variance. You find an example of this type of dashboard report below.
Purpose of Security Summary Portfolio Reports Banks use Security Summary Portfolio Reports to give managers an easy way to compare book value with market value and analyze the variances. When used as part of good business practices in Investment departments, a bank can improve its securities strategies and profitability, and it can reduce the chances that managers react slowly to significant book to market value variances.
Who Uses This Type of Dashboard Report? The typical users of this type of dashboard report are: Investment managers, securities portfolio managers, analysts. Other Reports Often Used in Conjunction with Security Summary Portfolio Reports Progressive Investment departments sometimes use several different Security Portfolio Reports, along with securities transactions reports, investment dashboards, KPI dashboards, securities dashboards and other management and control tools.
Where Does the Data for Analysis Originate From? The Actual (historical transactions) data typically comes from securities management systems and enterprise resource planning (ERP) systems like: Microsoft Dynamics 365 (D365) Finance, Microsoft Dynamics 365 Business Central (D365 BC), Microsoft Dynamics AX, Microsoft Dynamics NAV, Microsoft Dynamics GP, Microsoft Dynamics SL, Sage Intacct, Sage 100, Sage 300, Sage 500, Sage X3, SAP Business One, SAP ByDesign, Acumatica, Netsuite and others. In analyses where budgets or forecasts are used, the planning data most often originates from in-house Excel spreadsheet models or from professional xFP&A solutions.
To learn more, visit the Resource Library.
View Favorites