

Bank – Securities Dashboard
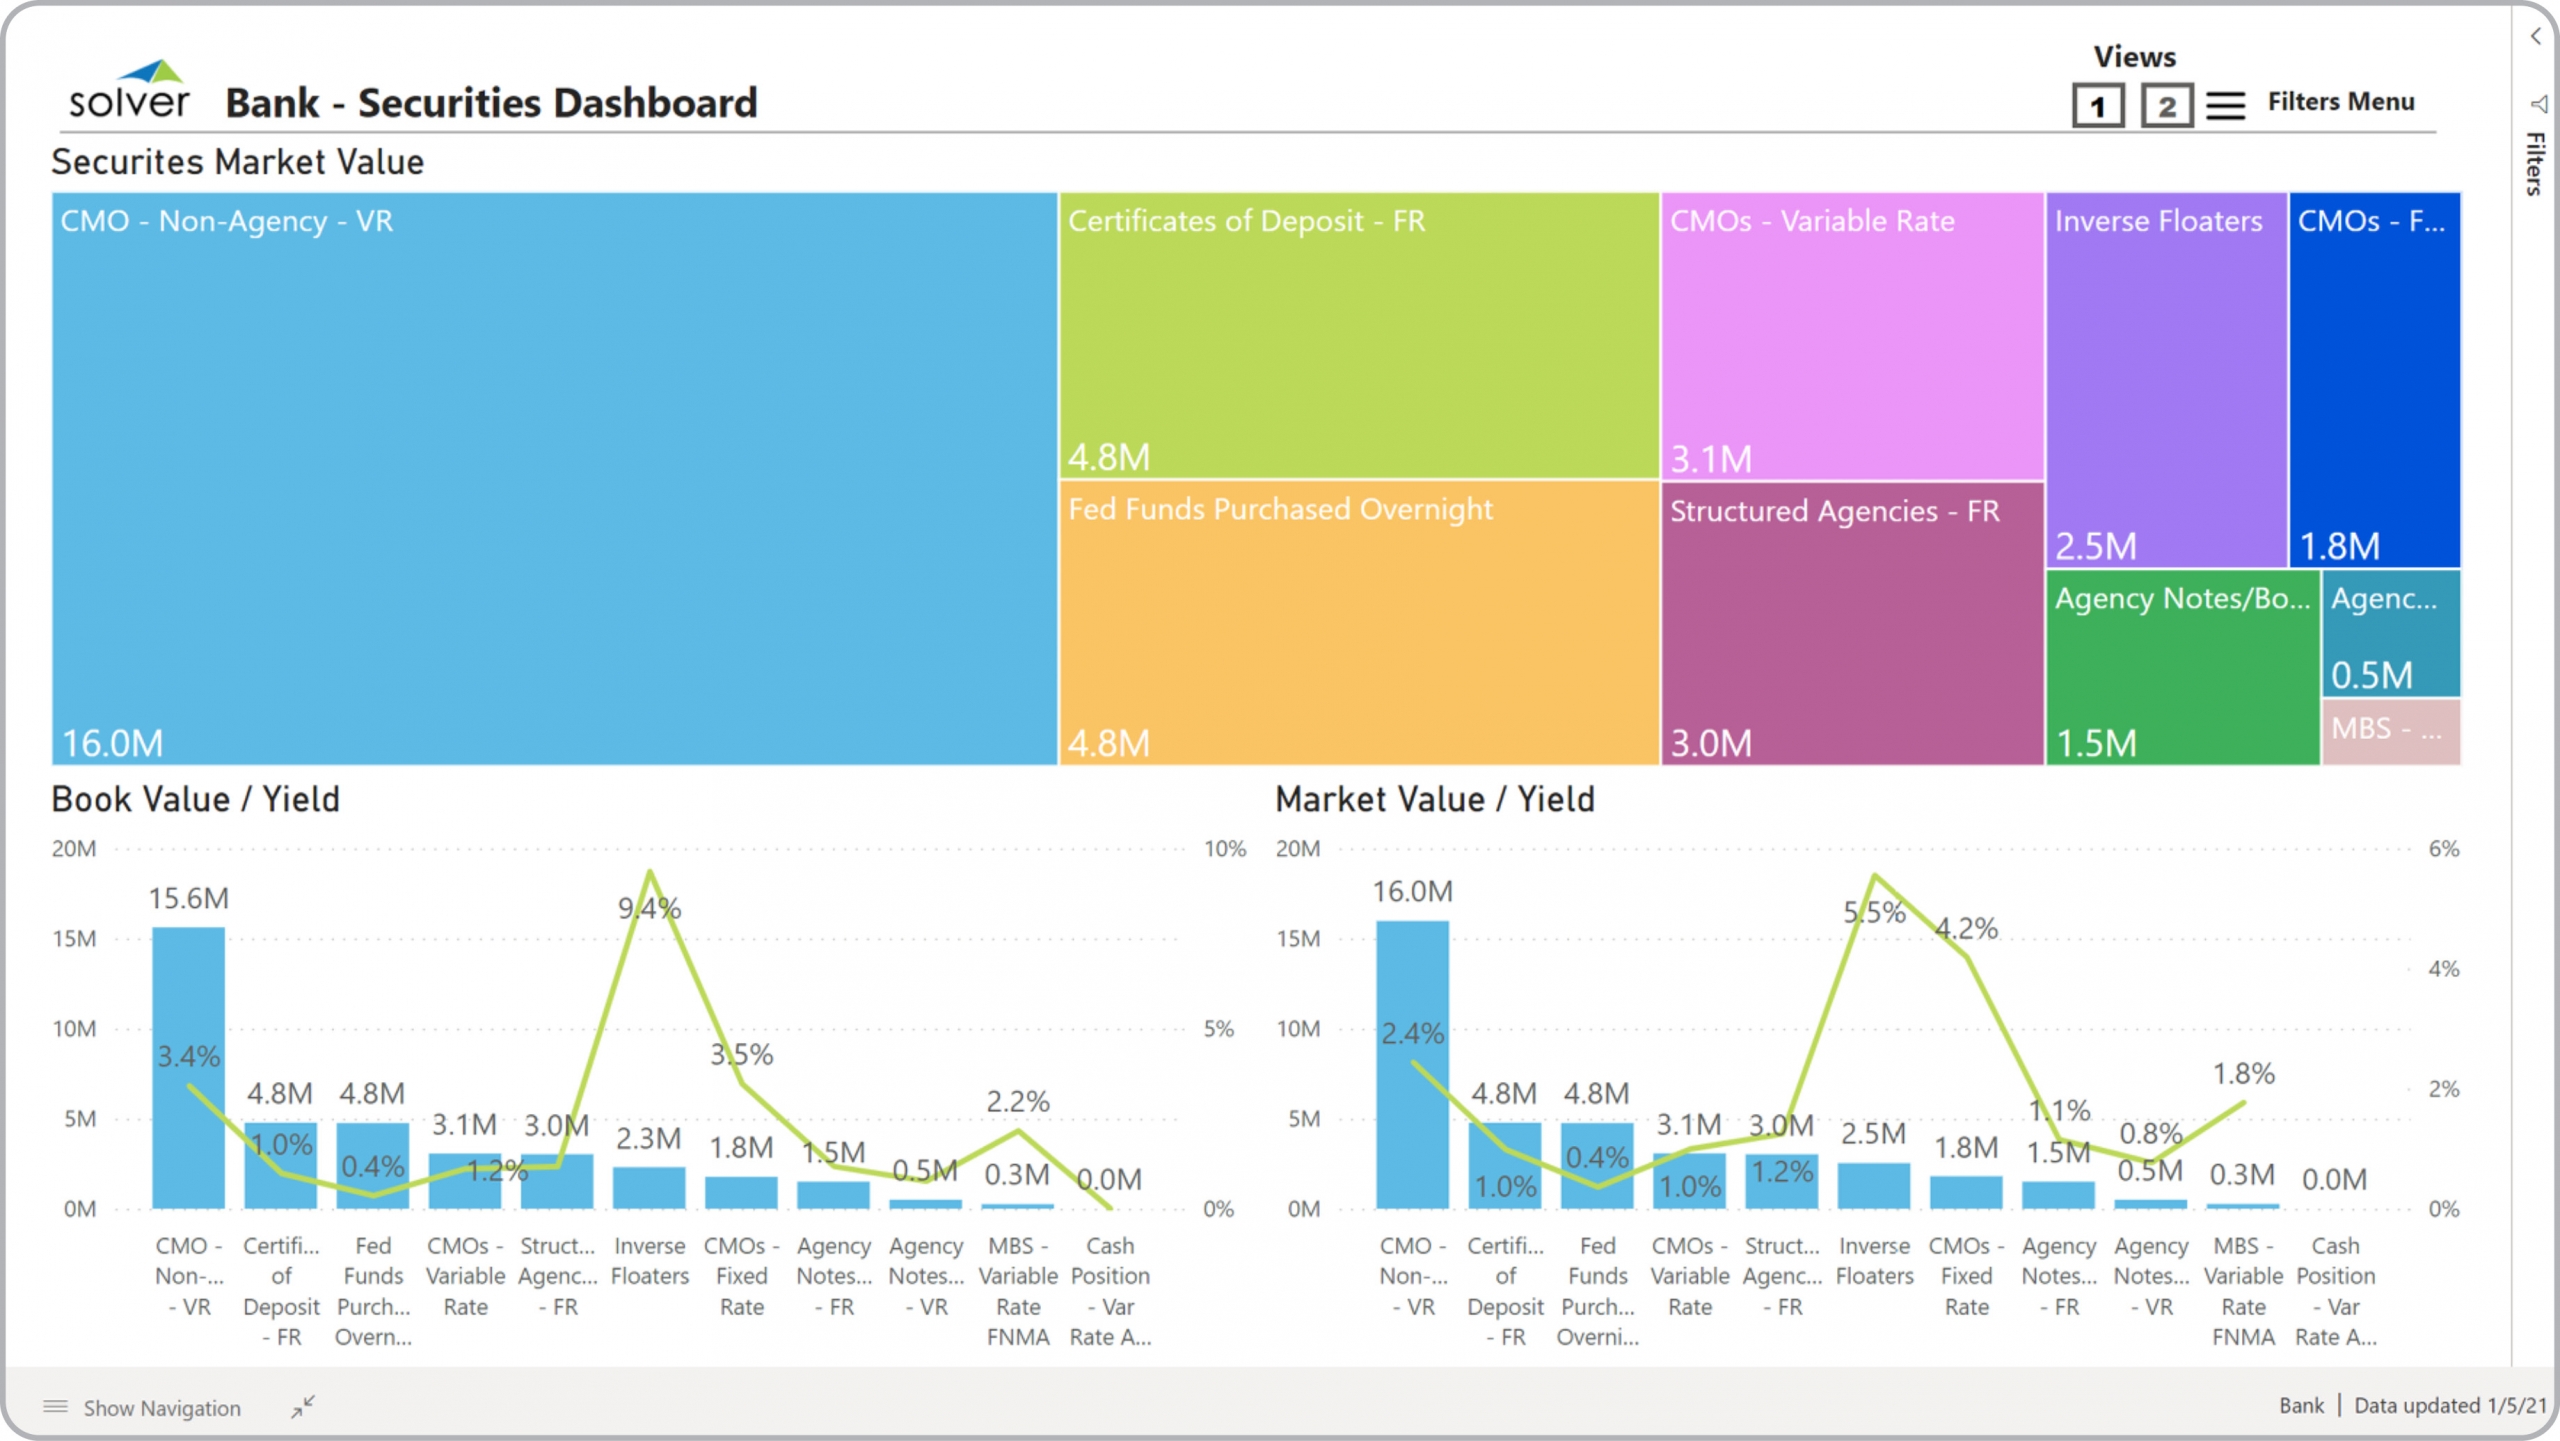
What is a Securities Dashboard for Banks? Securities Dashboards are considered financial instrument analysis tools and are used by executives and financial managers to analyze key metrics for the bank's financial instruments. Some of the main functionality in this type of dashboard is that it track performance metrics from three different perspectives, including: 1) Tree map showing market value for the banks securities, 2) Ranked comparisons of book value and yield per financial instrument, and 3) Ranked comparisons of book value and yield per instrument. You find an example of this type of dashboard below.
Purpose of Securities Dashboards Banks use Securities Dashboards to give leaders and analysts a single screen to quickly see values and yields related to their financial instruments. When used as part of good business practices in Financial Planning & Analysis (FP&A) departments, a company can improve its decision-making and increase profitability, and it can reduce the chances that leaders miss important trends and KPI statuses.
Who Uses This Type of Dashboard? The typical users of this type of dashboard are: Executives, CFOs, analysts, securities managers, investment managers. Other Reports Often Used in Conjunction with Securities Dashboards Progressive Financial Planning & Analysis (FP&A) departments sometimes use several different Securities Dashboards, along with detailed securities dashboards, securities reports, investment reports, financial statements, forecasts and other management and control tools.
Where Does the Data for Analysis Originate From? The Actual (historical transactions) data typically comes from financial investment systems and enterprise resource planning (ERP) systems like: Microsoft Dynamics 365 (D365) Finance, Microsoft Dynamics 365 Business Central (D365 BC), Microsoft Dynamics AX, Microsoft Dynamics NAV, Microsoft Dynamics GP, Microsoft Dynamics SL, Sage Intacct, Sage 100, Sage 300, Sage 500, Sage X3, SAP Business One, SAP ByDesign, Acumatica, Netsuite and others. In analyses where budgets or forecasts are used, the planning data most often originates from in-house Excel spreadsheet models or from professional xFP&A solutions.
Built for banking finance teams and aligned with Solver's xFP&A platform, this Solver dashboard template connects directly to your ERP data via the Solver Data Warehouse, enabling near real-time analysis with minimal setup. Designed for QuickStart deployment, it can be activated rapidly so your team can focus on analysis and decisions — not data preparation.
What is the Bank – Securities Dashboard in Solver? The Bank – Securities Dashboard is a pre-built xFP&A dashboard template in Solver designed for banking organizations. It delivers key financial and operational metrics in a single, easy-to-use interface — purpose-built for banking finance workflows.
Who uses this Solver dashboard template? This template is primarily used by CFOs, finance managers, and bank executives in banking organizations who need accurate, timely data to support planning, reporting, and decision-making. It is particularly valuable for banking finance teams managing budgets, forecasts, and performance reviews.
Where does the data come from? Data is sourced automatically from your ERP system through the Solver Data Warehouse, which integrates with platforms such as Microsoft Dynamics 365 Business Central, Dynamics 365 Finance, Acumatica, Sage Intacct, and other leading ERP solutions. Core banking systems and loan management platforms are also supported as data sources. Once connected, the template updates in near real-time with no manual data entry required.
To learn more, visit the Resource Library.