

View Favorites
Pharma – Sales Management Power BI Dashboard
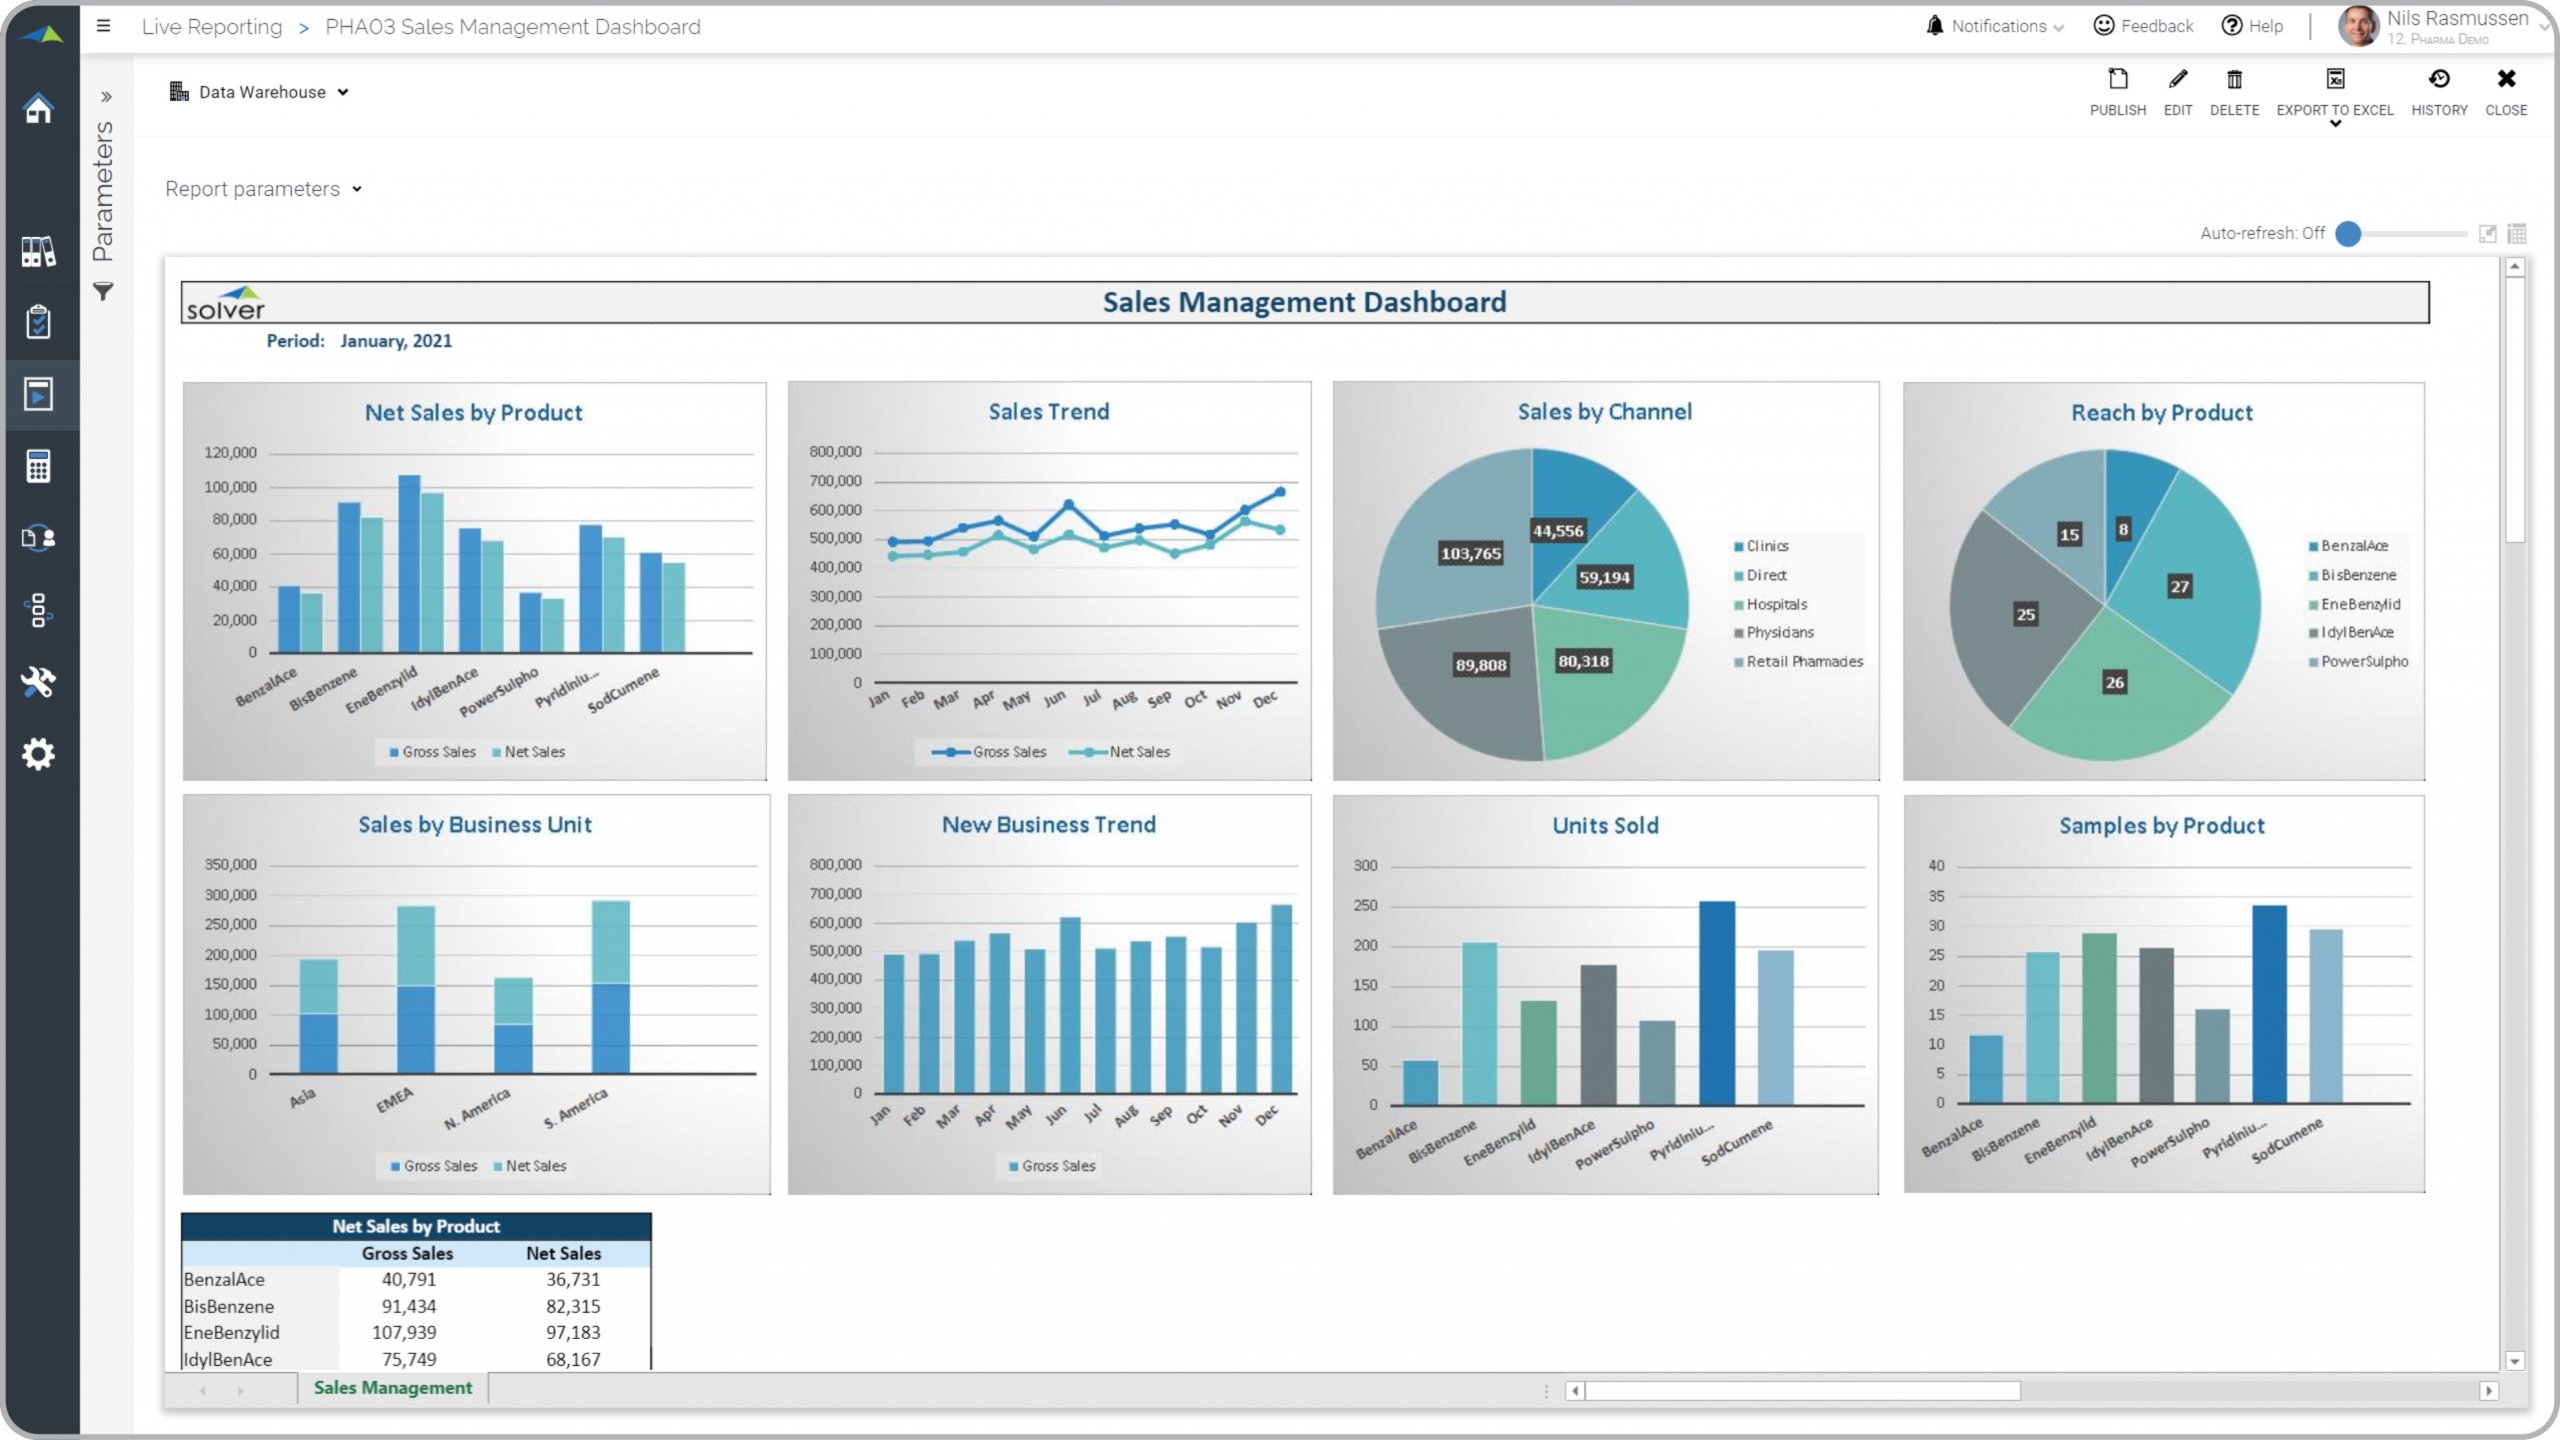
Power BI dashboard showing sales metrics as well as units sold and samples provided and reach.
What is a Sales Manager Dashboard? Sales Manager Dashboards are considered revenue analysis tools and are used by Sales Managers and executives to monitor sales performance across key business areas. Some of the main functionality in this type of dashboard is that it enables analysis of metrics from eight different perspectives: 1) Ranked gross and net sales by product, 2) Monthly trend for gross and net sales, 3) Sales by channel, 4) Reach by product, 5) Ranked gross and net sales by business unit, 6) Monthly gross sales trend for new business, 7) Units sold by product, ranked, and 8) Samples given by product, ranked. You find an example of this type of dashboard below.
Purpose of Sales Manager Dashboards Pharmaceutical companies use Sales Manager Dashboards to easily monitor key sales metrics and trends on a single screen. When used as part of good business practices in Financial Planning & Analysis (FP&A) and Sales departments, an organization can improve its revenues, and it can reduce the chances that areas with weaker than expected performance don't get timely attention.
Who Uses This Type of Dashboard? The typical users of this type of dashboard are: Sales managers, product managers, executives. Other Reports Often Used in Conjunction with Sales Manager Dashboards Progressive Financial Planning & Analysis (FP&A) and Sales departments sometimes use several different Sales Manager Dashboards, along with profit & loss reports, annual budgets, sales forecasts, detailed sales reports, revenue dashboards, KPI dashboards and other management and control tools.
Where Does the Data for Analysis Originate From? The Actual (historical transactions) data typically comes from enterprise resource planning (ERP) systems like: Microsoft Dynamics 365 (D365) Finance, Microsoft Dynamics 365 Business Central (D365 BC), Microsoft Dynamics AX, Microsoft Dynamics NAV, Microsoft Dynamics GP, Microsoft Dynamics SL, Sage Intacct, Sage 100, Sage 300, Sage 500, Sage X3, SAP Business One, SAP ByDesign, Acumatica, Netsuite and others. In analyses where budgets or forecasts are used, the planning data most often originates from in-house Excel spreadsheet models or from professional xFP&A solutions.
To learn more, visit the Resource Library.
View Favorites