

P&L – Rolling 13 Month
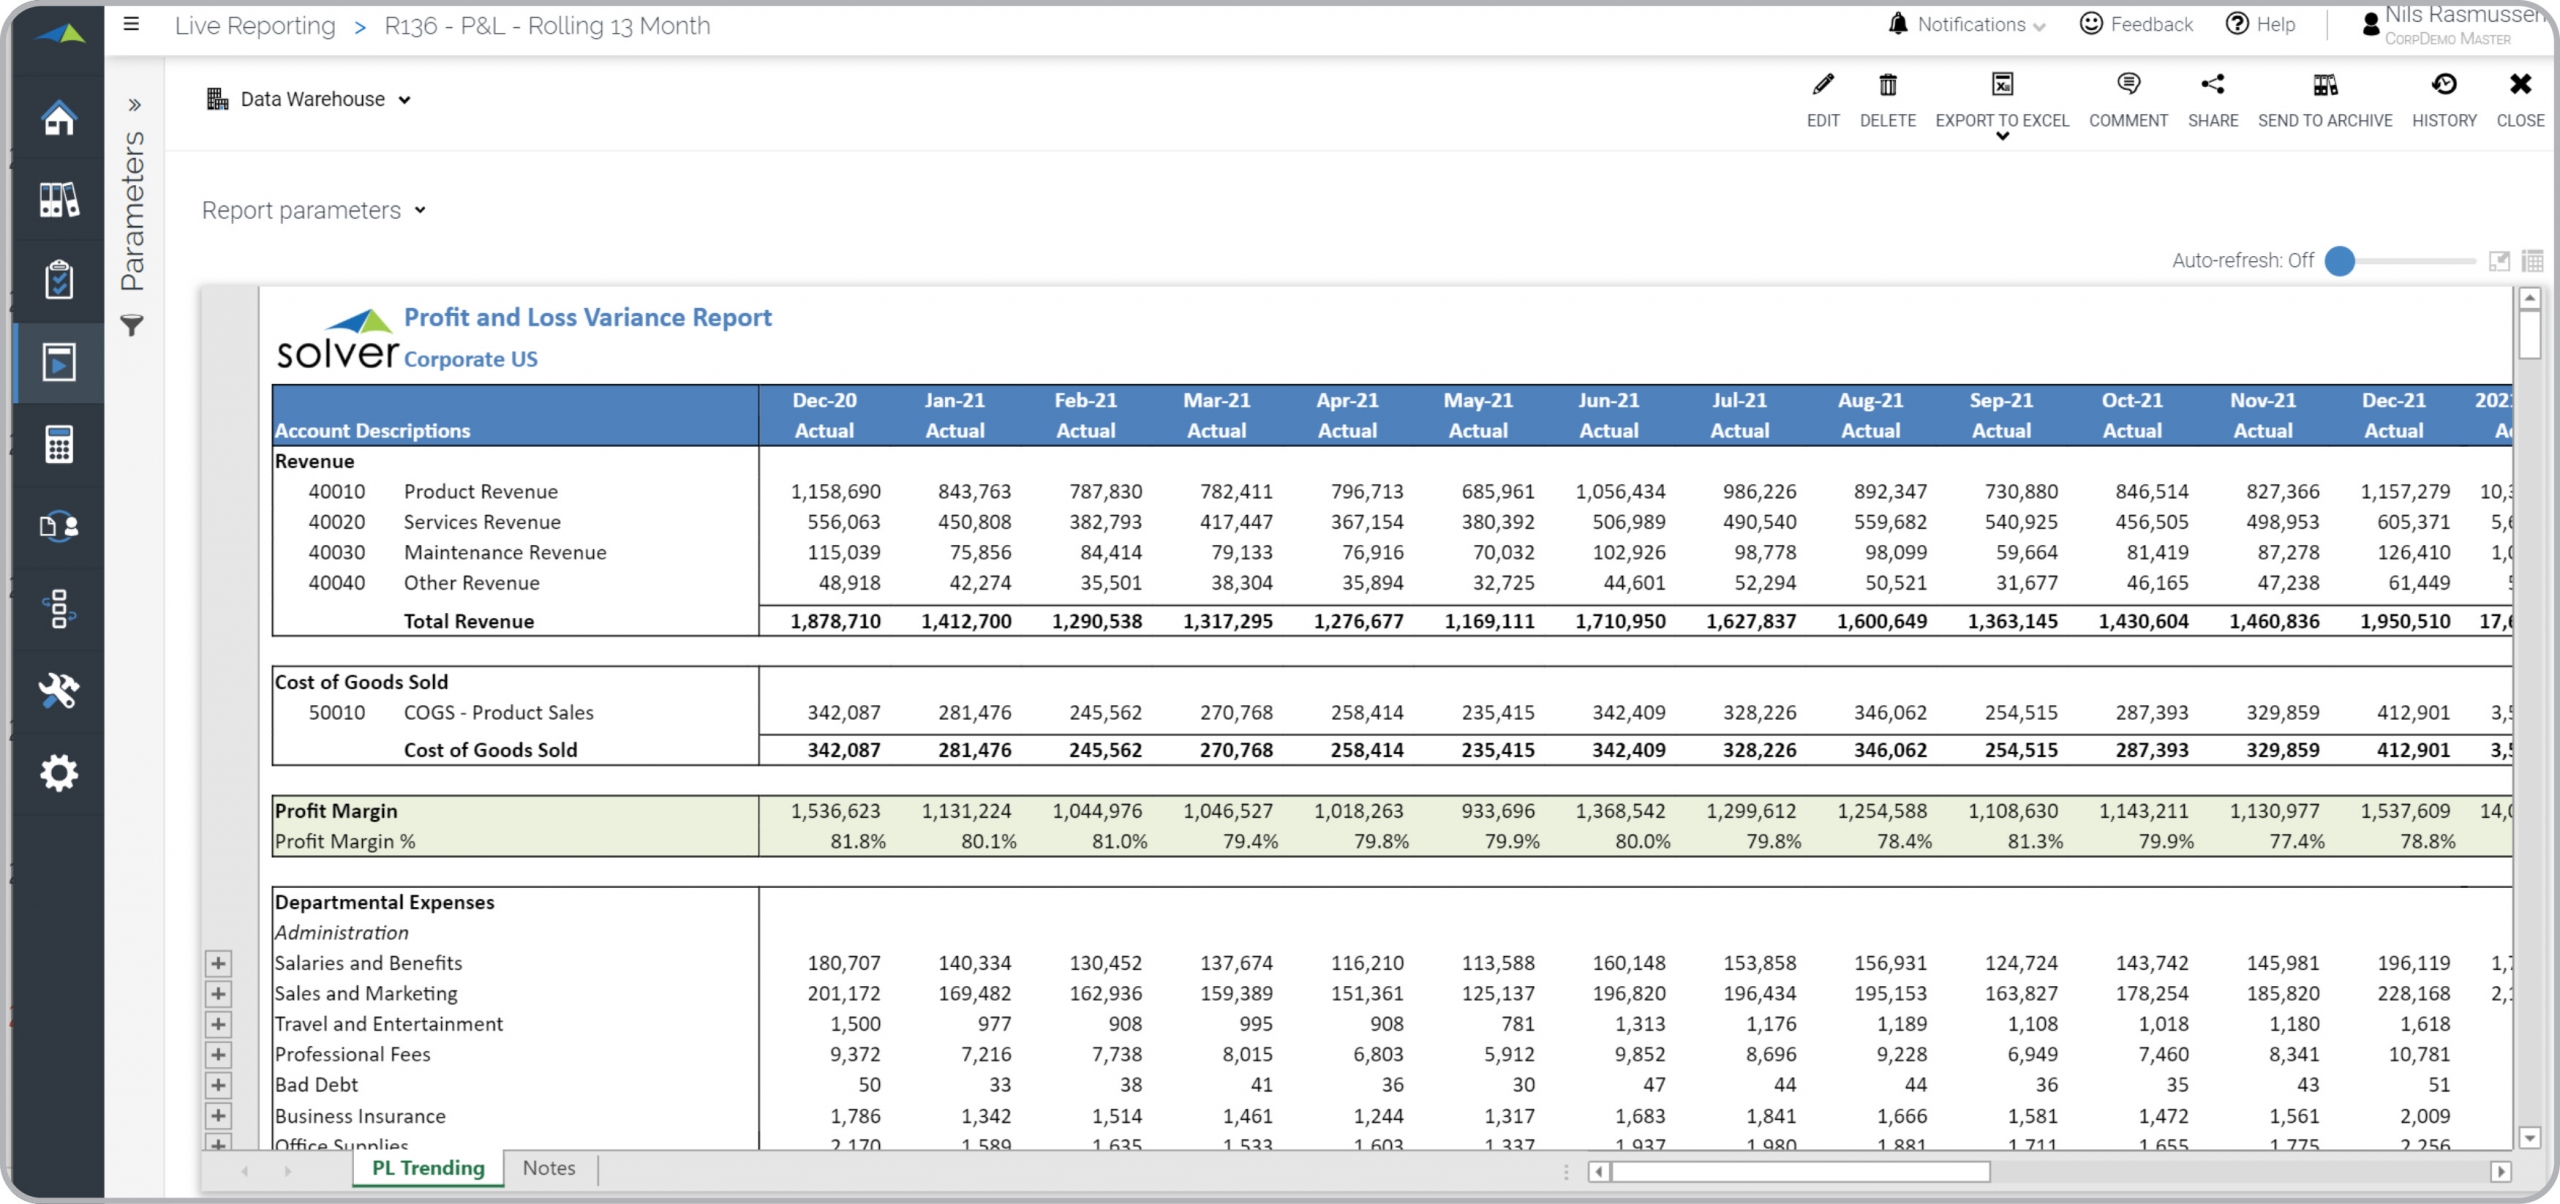
What is a Rolling 13 Month Profit & Loss Report? Rolling Profit & Loss Reports are considered financial trend reports and are often used by CFOs and Executives to analyze trends in profitability and the revenues and expenses driving it. Key functionality in this type of report automatically displays the full profit & loss for the current month as well as the prior 12 months. This feature is driven by the period parameter the user enters to run the report. You will find an example of this type of report below.
Purpose of Profit & Loss Rolling Trend Reports Companies and organizations use Profit & Loss Rolling Trend Reports to analyze how historical trends in revenues and expenses are affecting margins and profitability. When used as part of good business practices in a Financial Planning & Analysis (FP&A) Department, a company can improve its ability to track trends in revenues, expenses, margins and profitability, as well as, reduce the chance that important trends in metrics are missed that could result in a deterioration in gross margin and/or profits.
Who Uses This Type of Report? The typical users of this type of report are: CFOs and Executives. Other Reports Often Used in Conjunction with Profit & Loss Rolling Trend Reports Progressive Financial Planning & Analysis (FP&A) Departments sometimes use several different Profit & Loss Rolling Trend Reports, along with trended balance sheets, cash flow statements and other management and control tools.
Where Does the Data for Analysis Originate From? The Actual (historical transactions) data typically comes from enterprise resource planning (ERP) systems like: Microsoft Dynamics 365 (D365) Finance, Microsoft Dynamics 365 Business Central (D365 BC), Microsoft Dynamics AX, Microsoft Dynamics NAV, Microsoft Dynamics GP, Microsoft Dynamics SL, Sage Intacct, Sage 100, Sage 300, Sage 500, Sage X3, SAP Business One, SAP ByDesign, Acumatica, Netsuite and others. In analyses where budgets or forecasts are used, the planning data most often originates from in-house Excel spreadsheet models or from professional xFP&A solutions.
This Solver report template connects directly to your ERP data via the Solver Data Warehouse, enabling near real-time analysis with minimal setup. Designed for QuickStart deployment, it can be activated rapidly so your team can focus on analysis and decisions — not data preparation.
What is the P&L – Rolling 13 Month in Solver? The P&L – Rolling 13 Month is a pre-built xFP&A report template in Solver that delivers key financial and operational metrics in a single, easy-to-use interface, eliminating the need for manual data work or custom report development.
Who uses this Solver report template? CFOs, FP&A managers, and controllers use this report template to support month-end close, variance analysis, and management reporting. It is designed to be self-service and require no custom development.
Where does the data come from? Data is sourced automatically from your ERP system through the Solver Data Warehouse, which integrates with platforms such as Microsoft Dynamics 365 Business Central, Dynamics 365 Finance, Acumatica, Sage Intacct, and other leading ERP solutions. Once connected, the template updates in near real-time with no manual data entry required.
To learn more, visit the Resource Library.