

View Favorites
Professional Services – Revenue & Expense Analysis
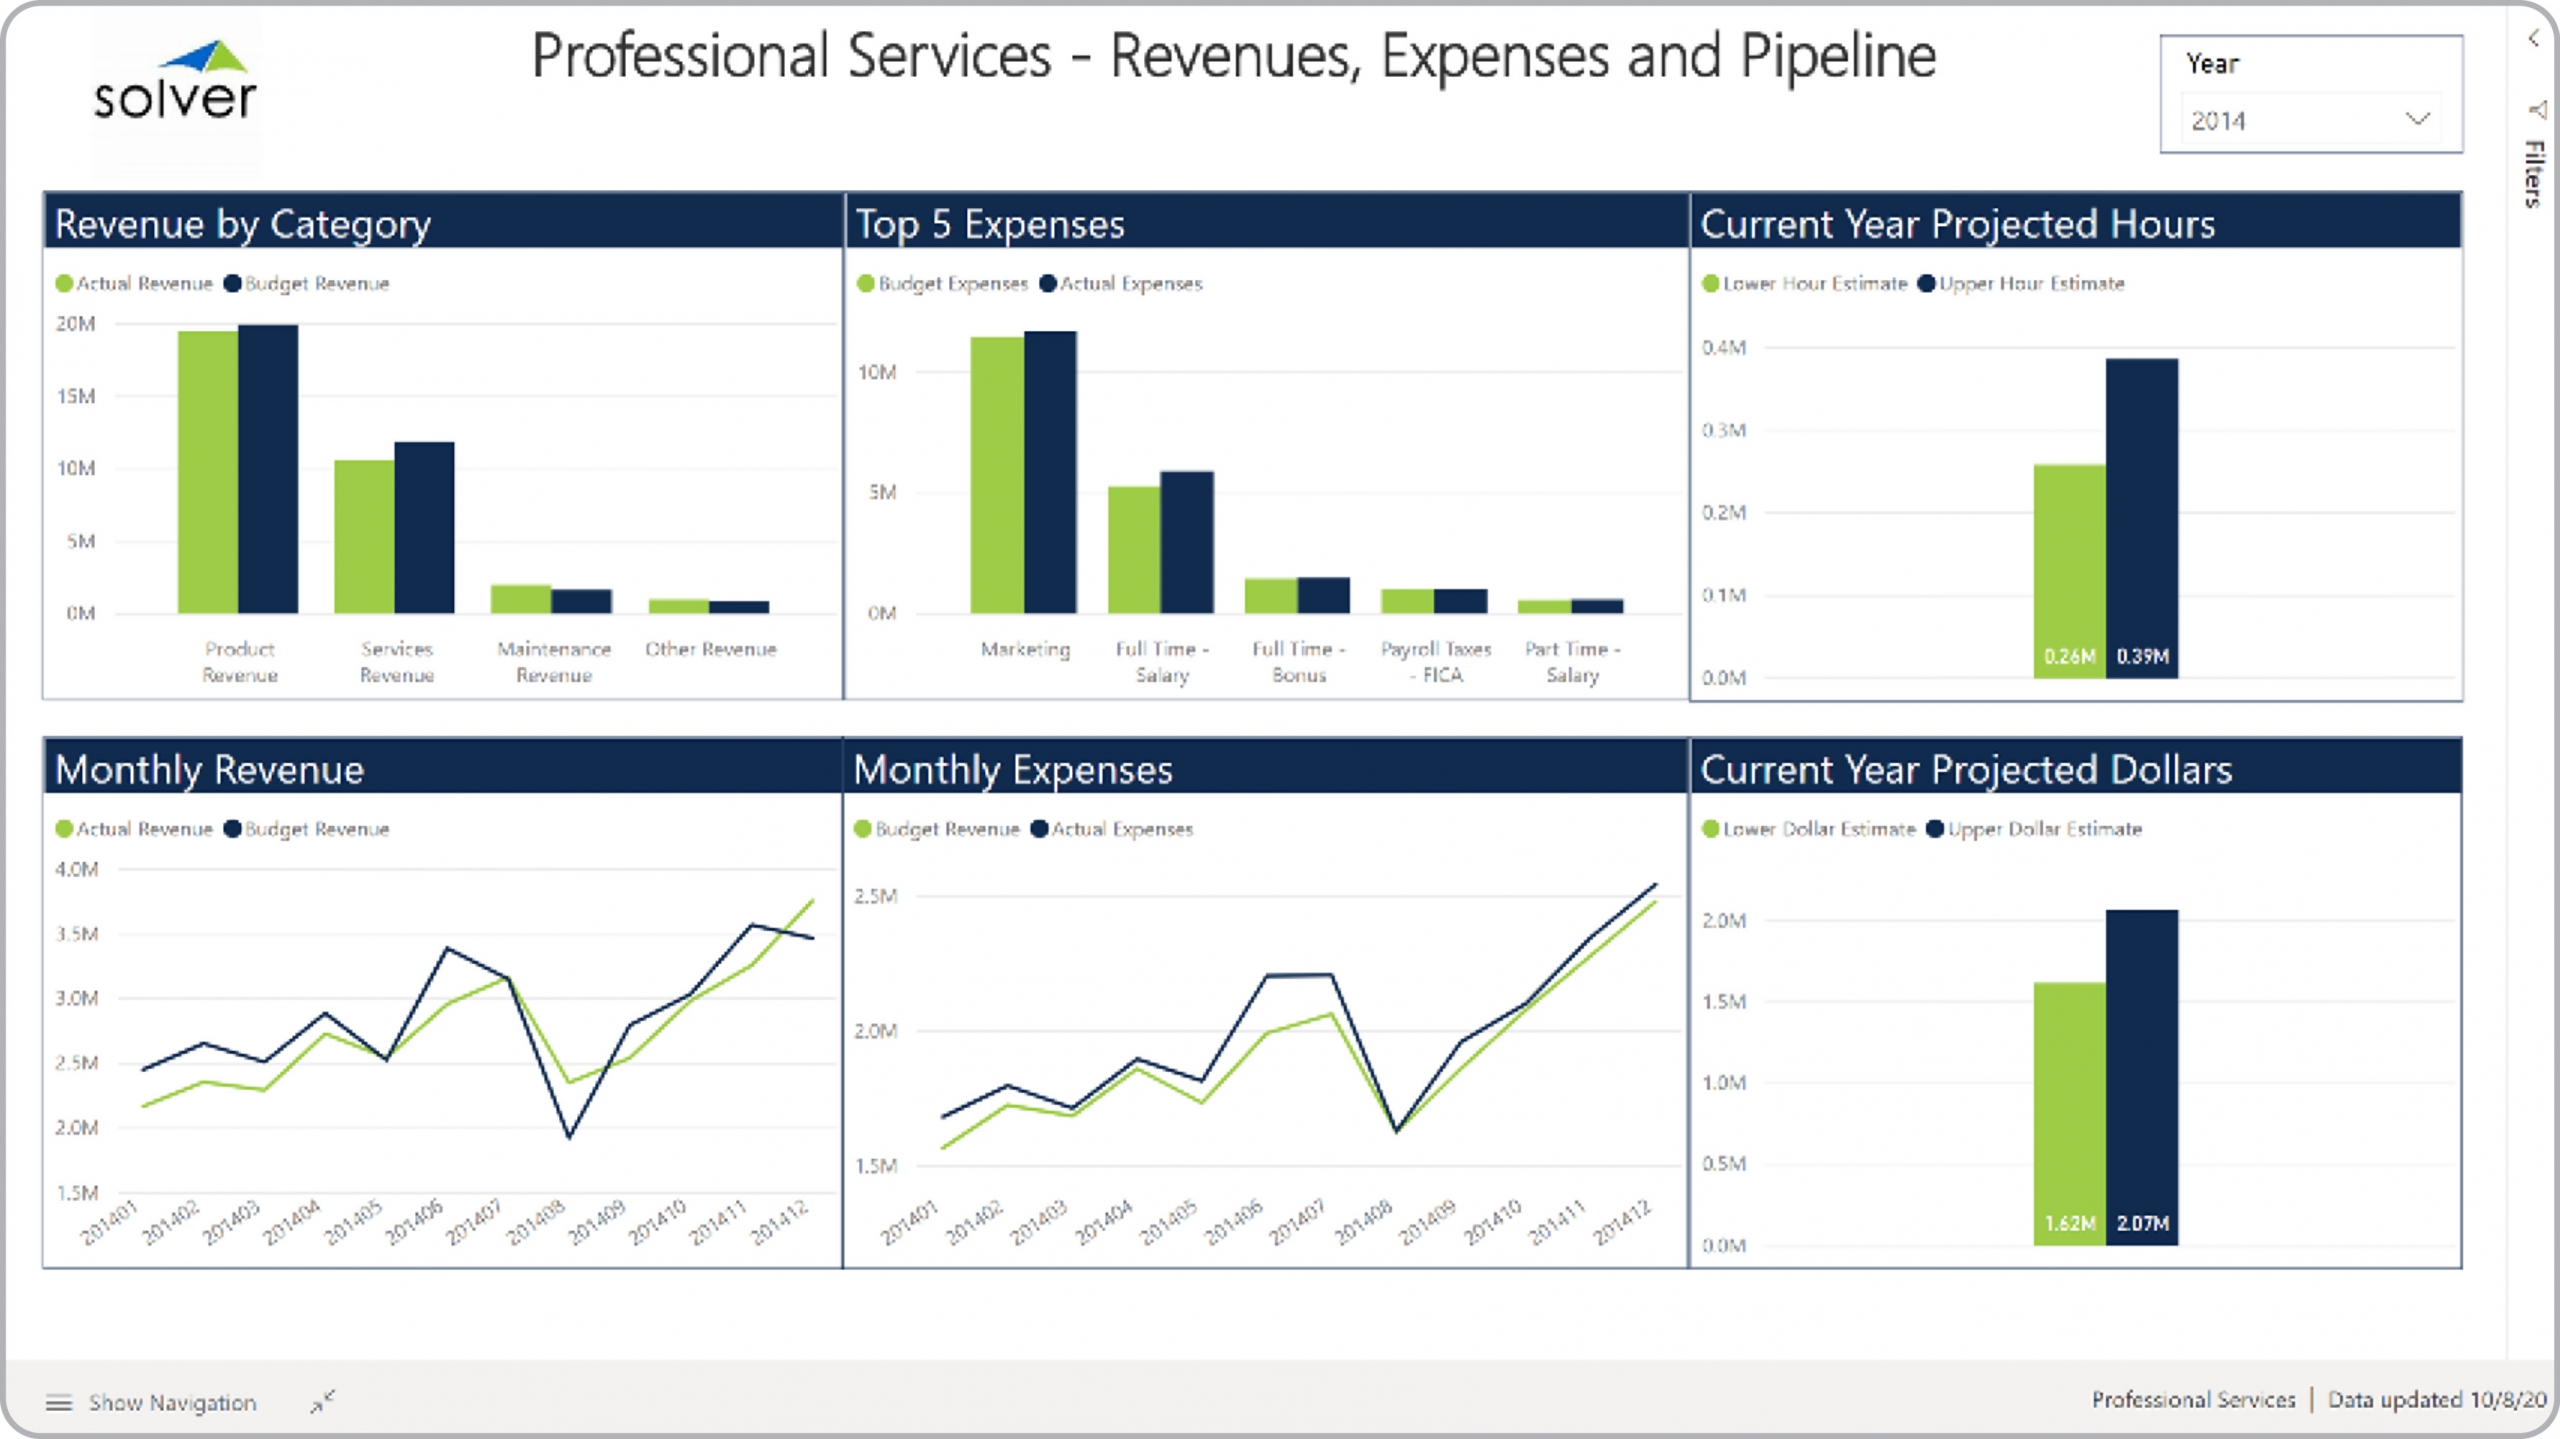
Power BI dashboard showing key financial metrics with actual to budget comparison and trend, hours and amount est.
What is a Revenue and Expense Dashboard? Revenue and Expense Dashboards are considered financial analysis tools and are used by Executives and CFOs to analyze trends and budget variances. Some of the main functionality in this type of dashboard is that it provides analysis of key corporate metrics from six different perspectives: 1) Actual and budgeted revenue ranked by category, 2) Top five actual and budgeted expenses, 3) Actual and budgeted monthly revenue trend, 4) Actual and budgeted monthly expense trend, 5) High and low estimate for current year projected hours, and 6) High and low estimate for current year projected billable amounts. You find an example of this type of dashboard below.
Purpose of Revenue and Expense Analysis Dashboards Professional services organizations use Revenue and Expense Analysis Dashboards to provide executives with a one page overview of key financial figures as well as a pipeline outlook for hours delivered. When used as part of good business practices in Financial Planning & Analysis (FP&A) departments, an organization can improve its strategic decisions and profitability, and it can reduce the chances that decision-makers are missing the big picture.
Who Uses This Type of Dashboard? The typical users of this type of dashboard are: Executives, CFOs, boards, analysts. Other Reports Often Used in Conjunction with Revenue and Expense Analysis Dashboards Progressive Financial Planning & Analysis (FP&A) departments sometimes use several different Revenue and Expense Analysis Dashboards, along with profit & loss reports, KPI dashboards, project dashboards, project reports, detailed billing reports, budget input models and other management and control tools.
Where Does the Data for Analysis Originate From? The Actual (historical transactions) data typically comes from enterprise resource planning (ERP) systems like: Microsoft Dynamics 365 (D365) Finance, Microsoft Dynamics 365 Business Central (D365 BC), Microsoft Dynamics AX, Microsoft Dynamics NAV, Microsoft Dynamics GP, Microsoft Dynamics SL, Sage Intacct, Sage 100, Sage 300, Sage 500, Sage X3, SAP Business One, SAP ByDesign, Acumatica, Netsuite and others. In analyses where budgets or forecasts are used, the planning data most often originates from in-house Excel spreadsheet models or from professional corporate performance management (CPM/EPM) solutions.
What Tools are Typically used for Reporting, Planning and Dashboards? Examples of business software used with the data and ERPs mentioned above are:
- Native ERP report writers and query tools
- Spreadsheets (for example Microsoft Excel)
- Corporate Performance Management (CPM) tools (for example Solver)
- Dashboards (for example Microsoft Power BI and Tableau)
To learn more, visit the Resource Library.
View Favorites