

View Favorites
Hospitality – Restaurant Analysis
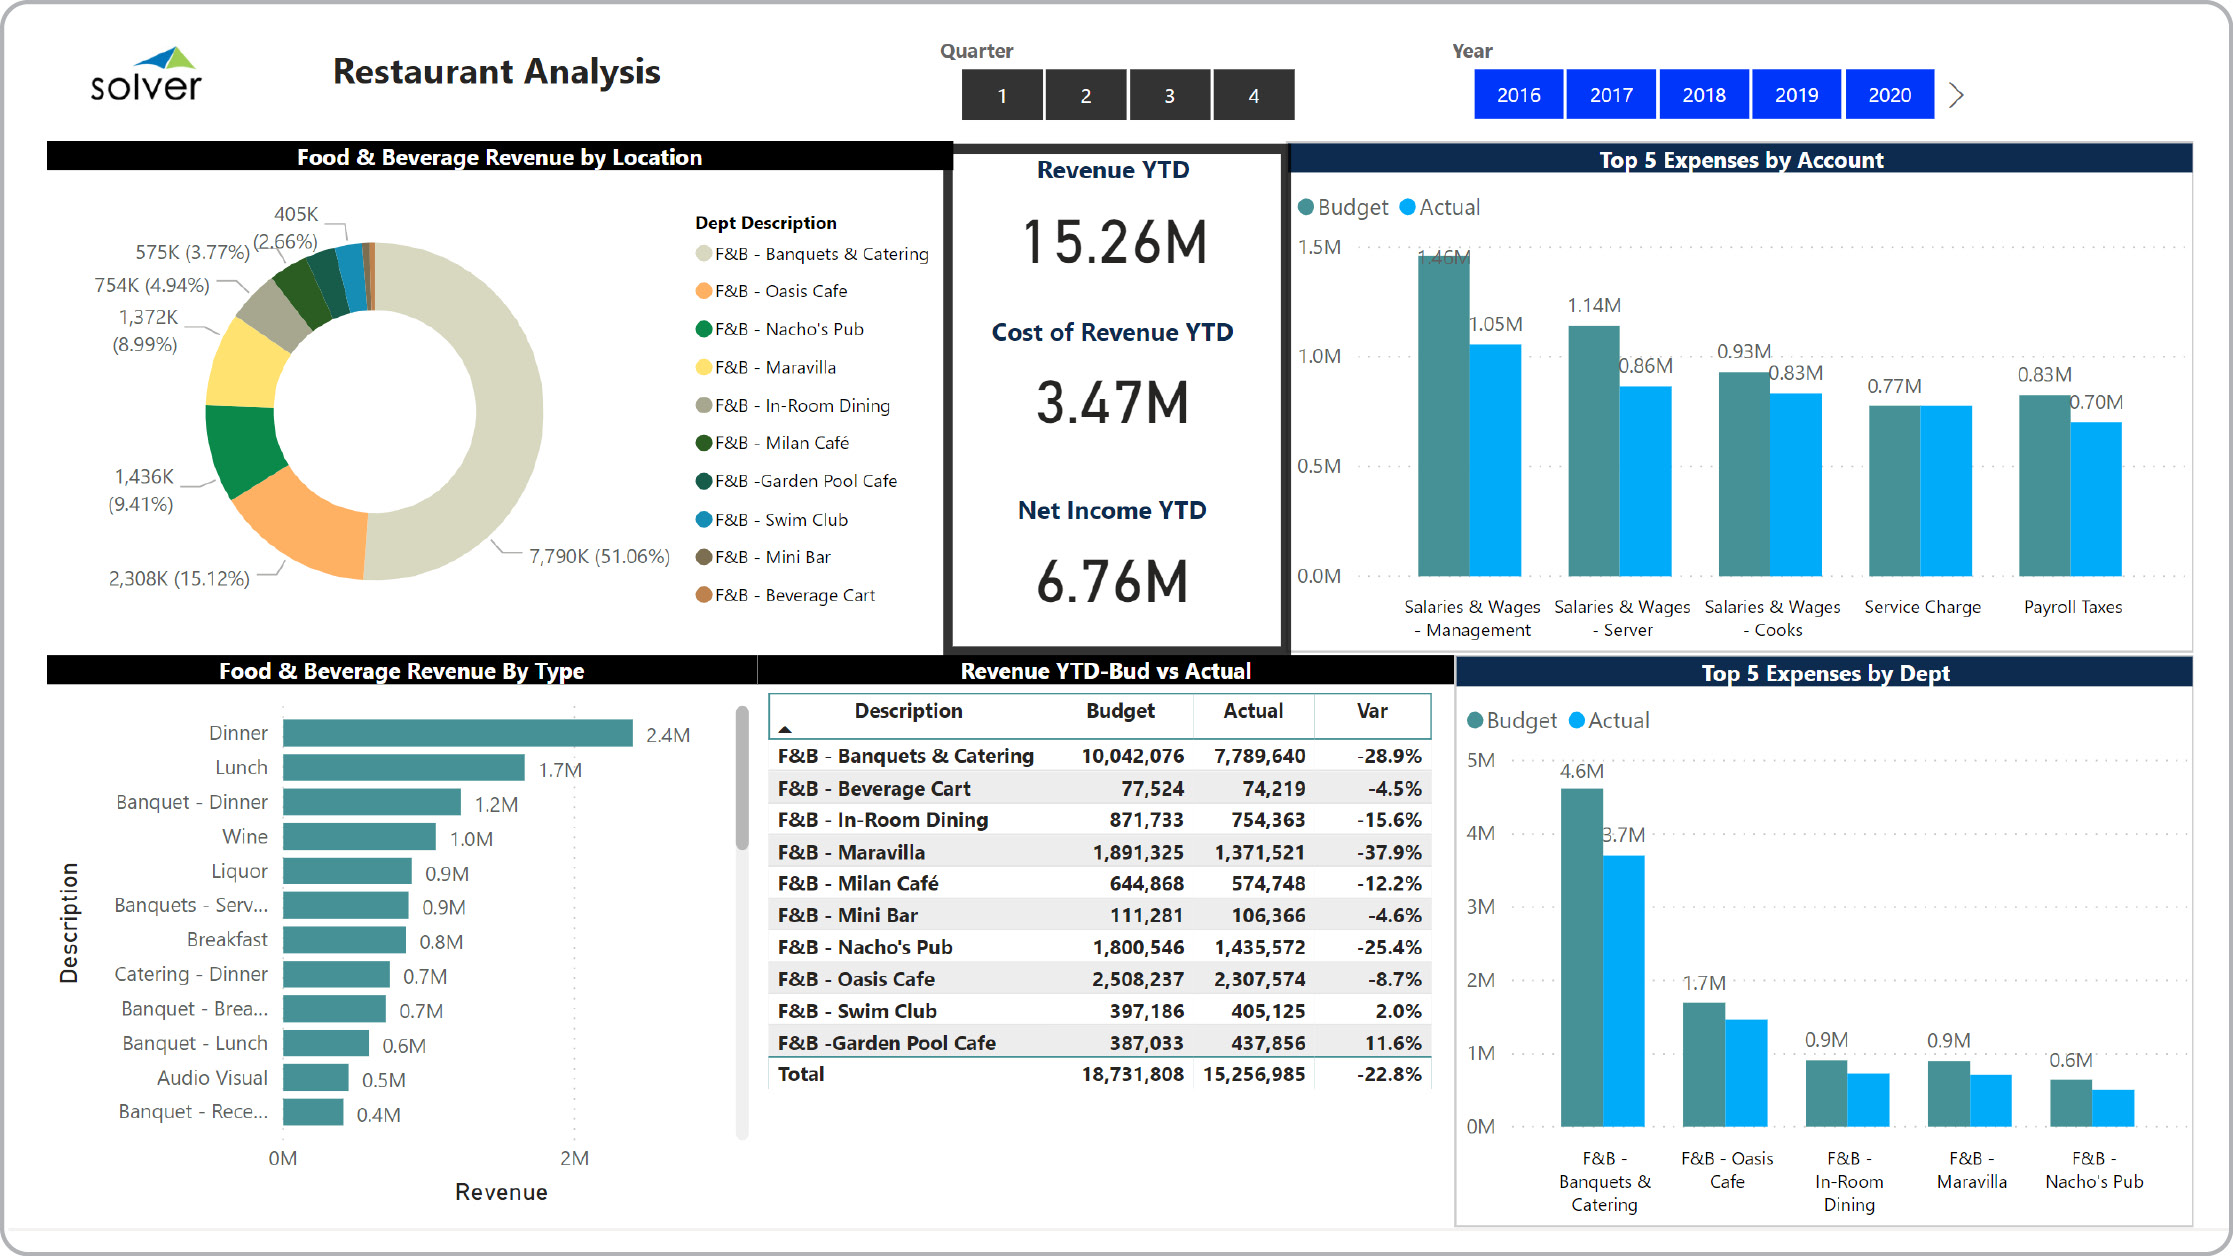
Power BI dashboard showing food & beverage analysis.
What is a Restaurant Dashboard? Restaurant Dashboards are considered financial analysis tools and are used by restaurant group managers and financial officers to monitor revenues, expenses and profitability across the organization. Some of the main functionality in this type of dashboard is that it displays the restaurant business from six different viewpoints, including: 1) Food and beverage revenue by location, 2) Food and beverage revenue by type, 3) Revenue, COGS and Net Income YTD, 4) Actual, budget and variance by GL revenue account, 5) Top 5 expenses by account and with actual versus budget comparison, and 6) Top 5 expenses by department. You find an example of this type of dashboard below.
Purpose of Restaurant Dashboards Hospitality organizations use Restaurant Dashboards to give restaurant executives a summary view of key financial metrics. When used as part of good business practices in a Financial Planning & Analysis (FP&A) department, an organization can improve and speed up its financial decisions and related strategies, and it can reduce the chances that managers miss major performance issue in any particular area of the business.
Who Uses This Type of Dashboard? The typical users of this type of dashboard are: Finance officers, analysts, restaurant managers, hospitality executives. Other Reports Often Used in Conjunction with Restaurant Dashboards Progressive Financial Planning & Analysis (FP&A) departments sometimes use several different Restaurant Dashboards, along with Revenue dashboards, profit & loss reports, cash flow reports, forecast models and other management and control tools.
Where Does the Data for Analysis Originate From? The Actual (historical transactions) data typically comes from enterprise resource planning (ERP) systems like: Microsoft Dynamics 365 (D365) Finance, Microsoft Dynamics 365 Business Central (D365 BC), Microsoft Dynamics AX, Microsoft Dynamics NAV, Microsoft Dynamics GP, Microsoft Dynamics SL, Sage Intacct, Sage 100, Sage 300, Sage 500, Sage X3, SAP Business One, SAP ByDesign, Acumatica, Netsuite and others. In analyses where budgets or forecasts are used, the planning data most often originates from in-house Excel spreadsheet models or from professional xFP&A solutions.
To learn more, visit the Resource Library.
View Favorites