

View Favorites
Real Estate – Regional Comparison
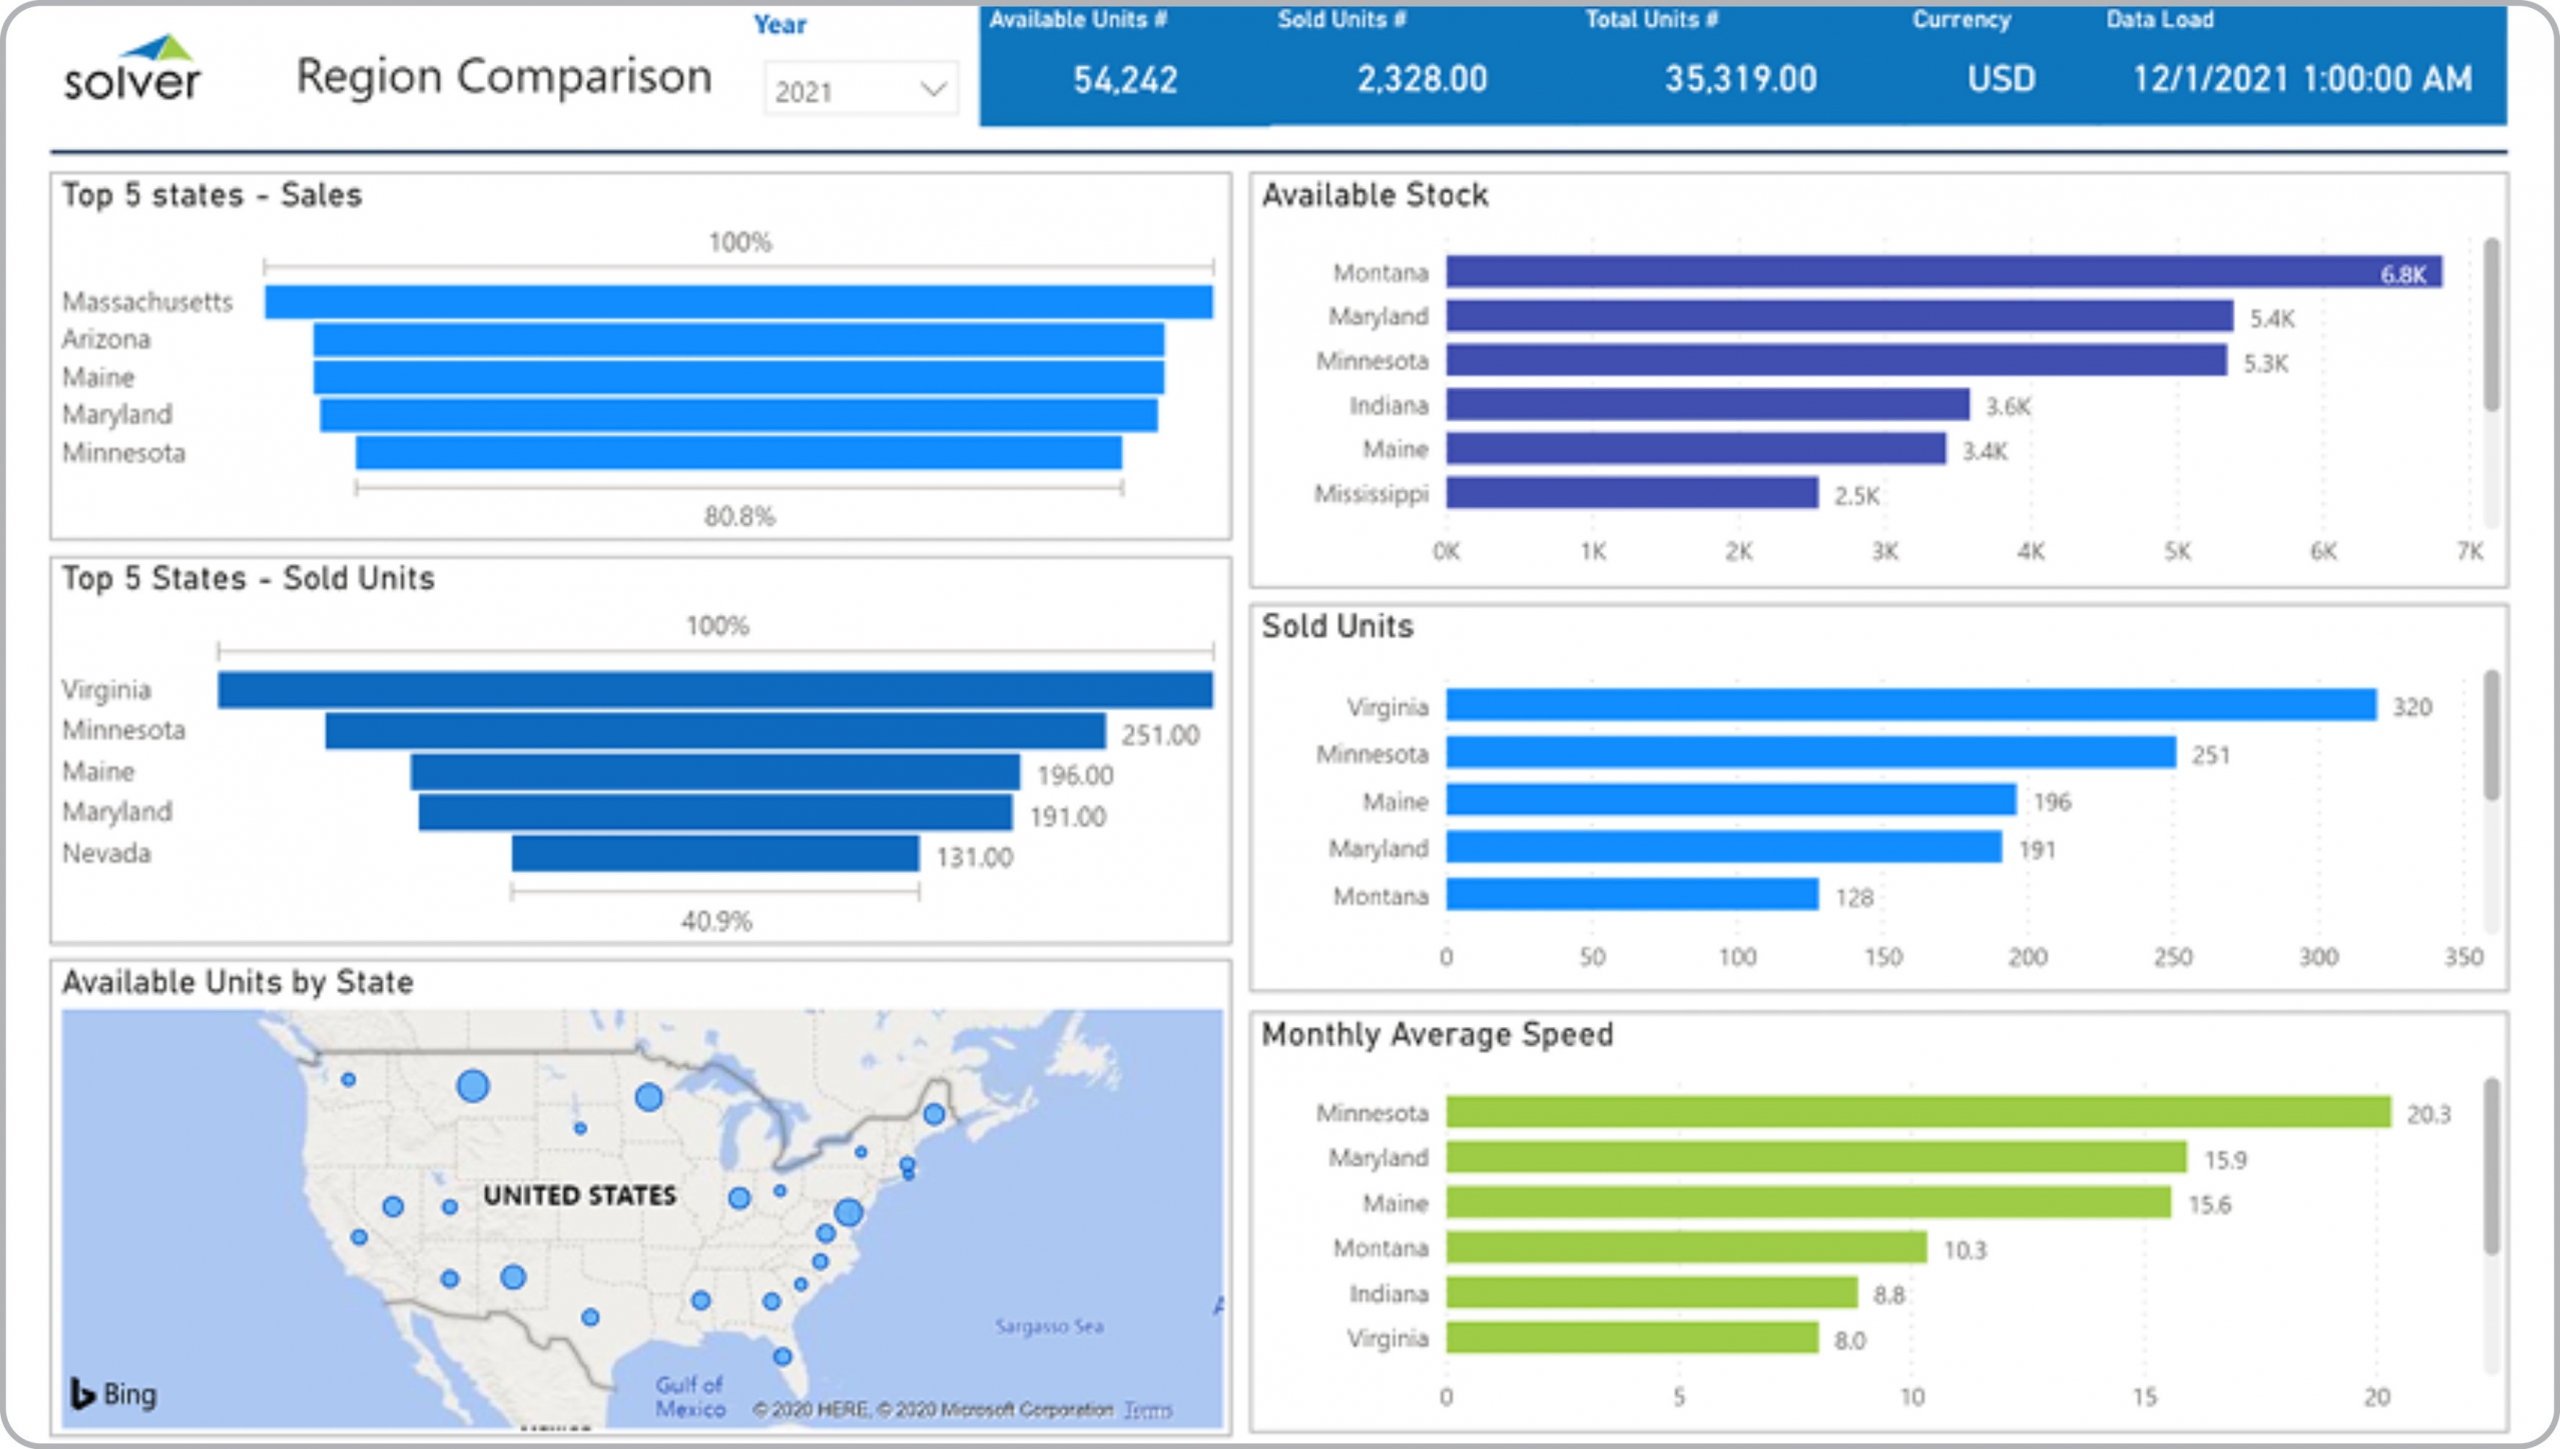
Power BI dashboard for comparison of sales by region in units sold and by speed of sales
What is a Regional Sales KPI Dashboard? Geographic focused real estate sales dashboards are considered sales analysis tools and are used by Executives and sales leaders to analyze regional performance. Some of the main functionality in this type of dashboard is that it provides KPI analysis from seven different perspectives. These include 1) Sales (%) for the top 5 states, 2) Sold units for the top 5 states, 3) Available units by state (map), 4) Available stock ranked by state, 5) Sold units ranked by state, 6) Monthly average speed (days to turn over real estate inventory), and 7) Grand total KPIs for available units, sold units, and total units. You find an example of this type of dashboard below.
Purpose of Regional Sales Dashboards for Real Estate Companies Real Estate organizations use Regional Sales Dashboards to give managers an easy way to compare performance across all their geographic regions. When used as part of good business practices in Financial Planning & Analysis (FP&A) and sales departments, an organization can improve and speed up its regional strategies and grow revenues, and it can reduce the chances that managers don't quickly catch location-related anomalies.
Who Uses This Type of Dashboard? The typical users of this type of dashboard are: Executives, CFOs, analysts, regional managers. Other Reports Often Used in Conjunction with Regional Sales Dashboards for Real Estate Companies Progressive Financial Planning & Analysis (FP&A) departments sometimes use several different Regional Sales Dashboards, along with financial dashboards, consolidated and local office profit & loss reports, sales reports, sales forecast, annual budgets and other management and control tools.
Where Does the Data for Analysis Originate From? The Actual (historical transactions) data typically comes from enterprise resource planning (ERP) systems like: Microsoft Dynamics 365 (D365) Finance, Microsoft Dynamics 365 Business Central (D365 BC), Microsoft Dynamics AX, Microsoft Dynamics NAV, Microsoft Dynamics GP, Microsoft Dynamics SL, Sage Intacct, Sage 100, Sage 300, Sage 500, Sage X3, SAP Business One, SAP ByDesign, Acumatica, Netsuite and others. In analyses where budgets or forecasts are used, the planning data most often originates from in-house Excel spreadsheet models or from professional xFP&A solutions.
To learn more, visit the Resource Library.
View Favorites